Fig. 5.
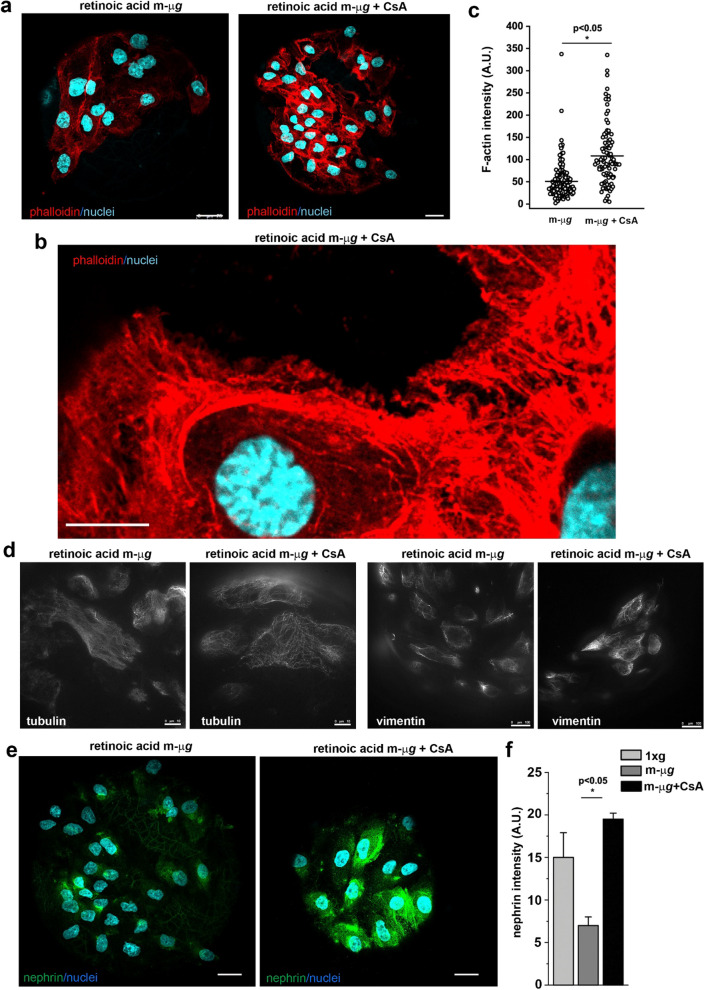
The presence of Cyclosporine A during modeled microgravity exposure restored renal progenitor cell differentiation into podocyte. a Confocal images of phalloidin (red fluorescence), and DAPI (light blue) staining in RPCs cultured for 72 h with retinoic acid in modeled μg conditions in absence (left) or in presence (right) of CsA. BAR = 25 μm. b Higher magnification view of phalloidin (red fluorescence), and DAPI (light blue) staining in RPCs cultured for 72 h with retinoic acid in modeled μg conditions in presence of CsA. BAR = 10 μm. c Quantitative analysis of phalloidin staining in RPCs cultured for 72 h with retinoic acid in modeled μg conditions in absence or in presence of CsA. At least 50 cells for each condition were analyzed from two independent experiments. d Images of tubulin and vimentin (white fluorescence) staining in RPCs cultured for 72 h with retinoic acid in absence or presence of CsA in modeled μg conditions. BAR = 10 μm for tubulin and BAR = 100 μm for vimentin. e Confocal images of nephrin expression (green fluorescence) and DAPI (light blue) staining in RPCs cultured for 72 h with retinoic acid in modeled μg conditions in absence (left) or in presence (right) of CsA. BAR = 25 μm. f Quantification of nephrin staining in RPCs cultured for 72 h with retinoic acid in modeled μg conditions in absence or in presence of CsA. Data are expressed as the mean ± SEM of two independent experiments. Statistical analysis was performed using the Mann–Whitney test. m-μg: modeled microgravity

