
Fig. 4: TIM-1 deletion in B cells enhances anti-tumor T cell immunity.
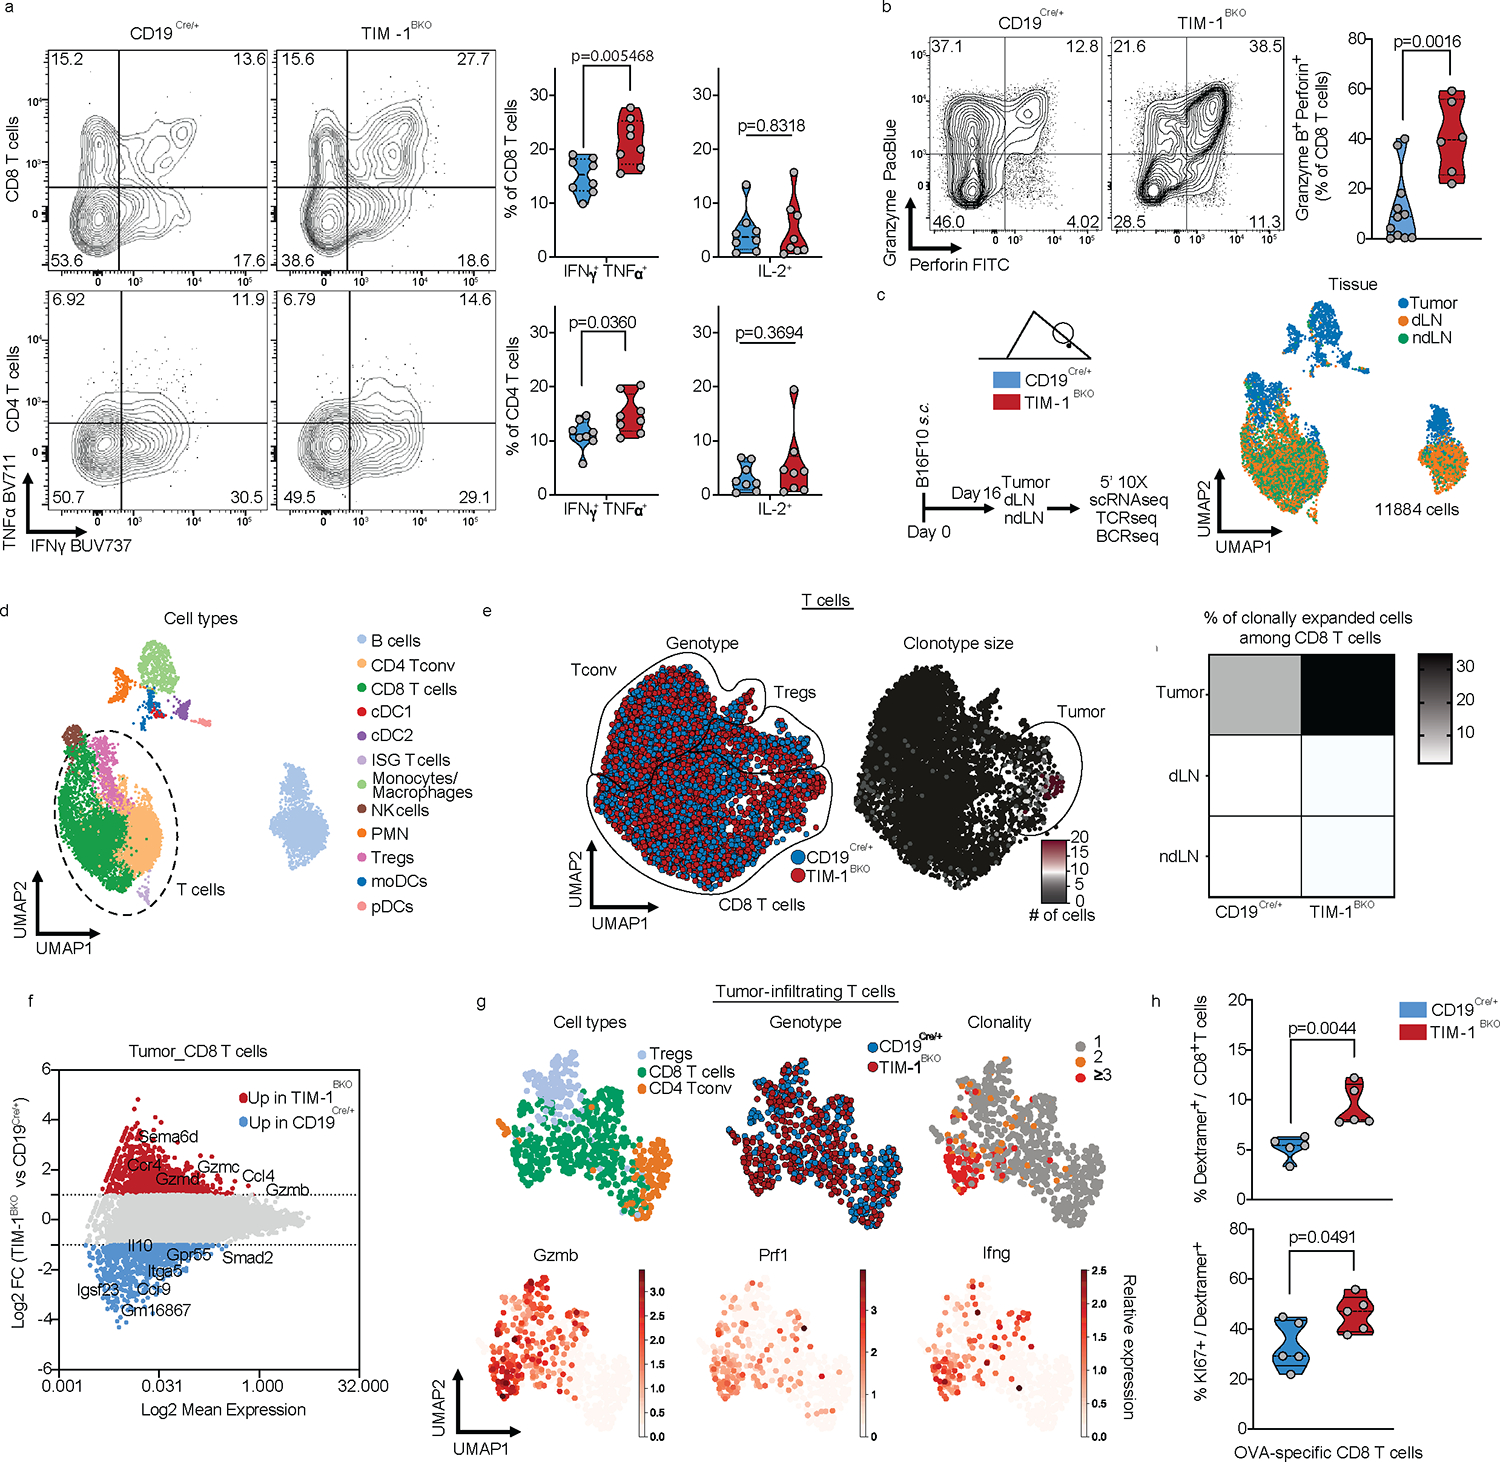
a and b, Flow cytometry analysis of TILs derived from CD19Cre/+ and TIM-1BKO mice implanted with B16F10 s.c. Representative FACS plot and percentage of IFNγ and TNFα double-producing cells and IL-2 within tumor-infiltrating CD8+ (top) and CD4+ (bottom) T cells (n=8 mice per group) (a), Representative FACS plot and percentage of Granzyme B and perforin double-expressing CD8+ T cells (n=11 controls and n=6 TIM-1BKO mice) (b). c-g, scRNA/BCR and TCR-seq of the TME, dLN and ndLN from CD19Cre/+ and TIM-1BKO mice bearing B16F10 melanoma. Schematic of the experimental design and UMAP of 11,884 CD45+ cells colored by their tissue of origin (c) and immune cell types (d). e, UMAP projection of CD19Cre/+ (blue) and TIM-1BKO (red) T cells delineated between CD4+ conventional T cells (Tconv), Tregs and CD8+ T cells (left panel) and clonally expanded T cells (middle panel). Frequencies of clonally expanded CD8+ T cells in different compartments (e, right panel). f, MA plot of gene expression comparing CD19Cre/+ versus TIM-1BKO CD8+ TILs. Positive log2 fold change corresponds to up-regulation within TIM-1BKO CD8+ TILs and vice versa. g, UMAP of TILs colored by cell types (top left), genotypes (top middle), clonal expansion (top right) and bottom panels show expression of the indicated markers. h, Frequencies of OVA-specific cells among CD8+ TILs (top) and KI67-expressing OVA-specific CD8+ TILs (bottom) (n=5 mice per group). Data are mean ± s.e.m and pooled from at least two to three independent experiments. two-tailed Student’s t-test in a, b and h.