
Fig. 5: TIM-1-deficiency in B cells unleashes B cell activation, antigen presentation and co-stimulatory function.
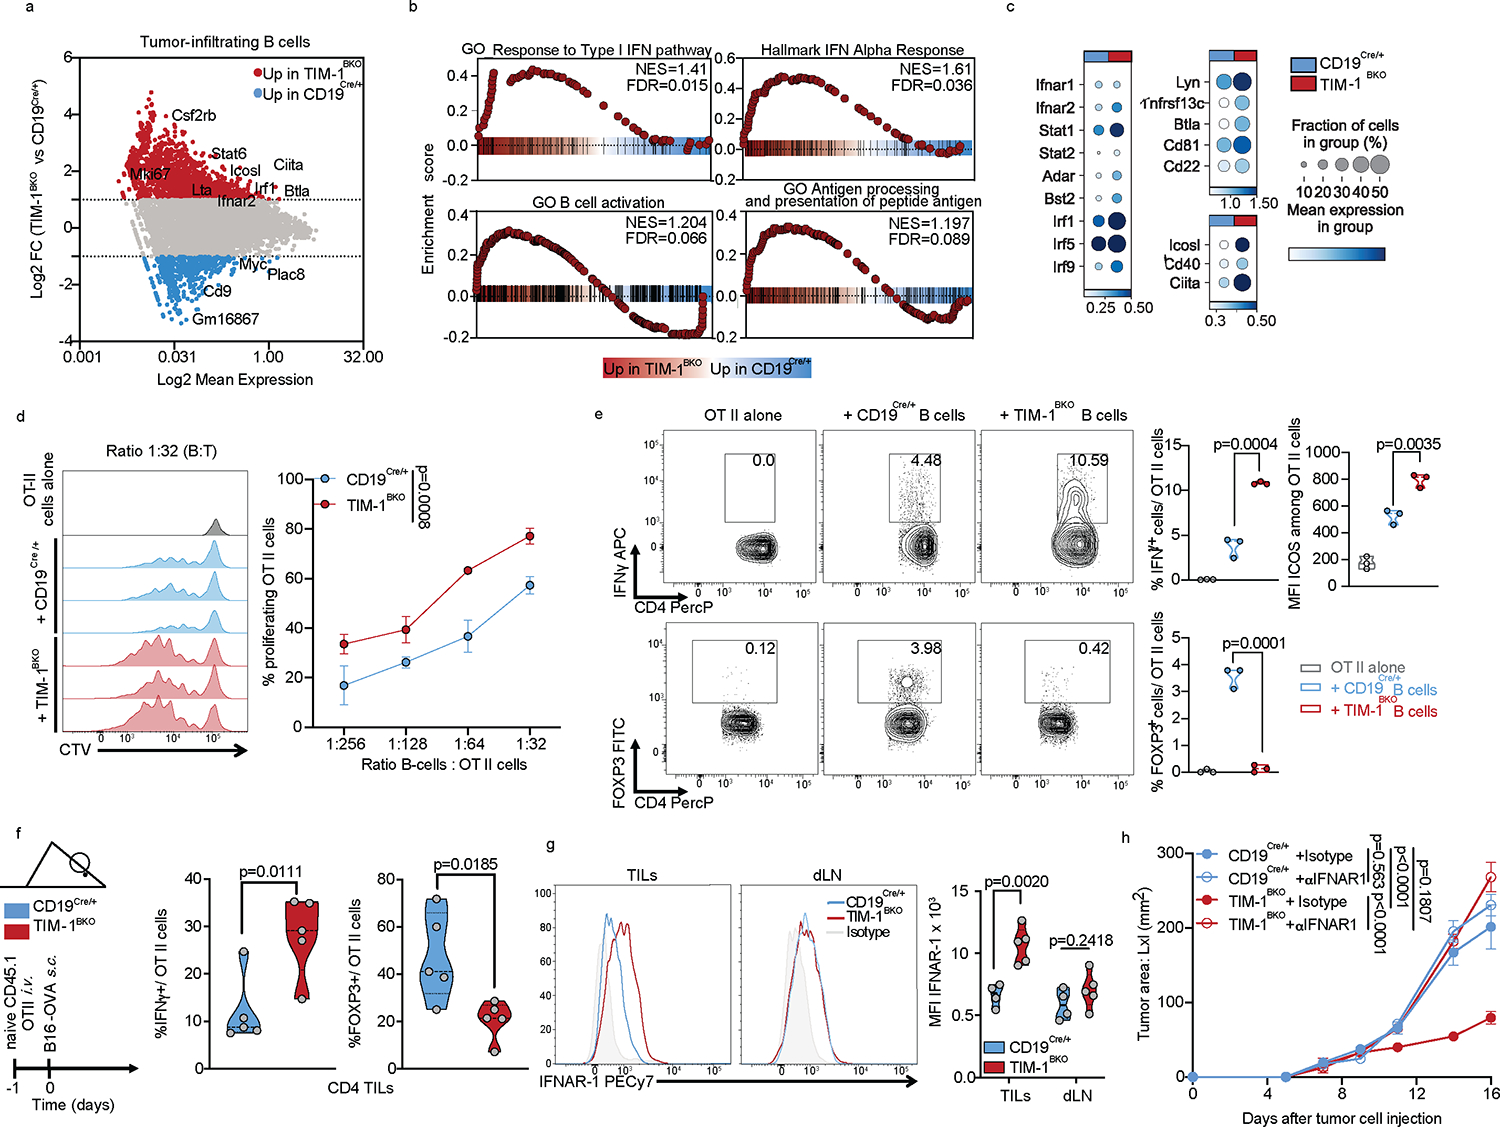
a-c, scRNAseq analysis of B cells derived from TILs, dLN and ndLN from CD19Cre/+ and TIM-1BKO mice bearing B16F10 melanoma. MA plot of gene expression comparing tumor-derived CD19Cre/+ and TIM-1BKO B cells (a), GSEA analysis (b) and dotplots depicting selected genes (c) between tumor-infiltrating TIM-1BKO and CD19Cre/+ B cells. Selected genes are annotated. d, OVA323–339 peptide-pulsed TIM-1BKO and CD19Cre/+ B cells were co-cultured with CTV-labeled OVA-restricted CD4+ T cells at different ratios for 4 days. T cell proliferation was determined by dilution of CTV. Representative histograms and quantitative analysis of proliferation indices are shown (n=3 mice per group). e, T cells were analyzed for expression of IFNγ, ICOS and FOXP3. Representative and quantitative data are shown. Circles denote data points from individual mice (n=3). f, Naïve CD45.1+ OVA-restricted CD4+ T cells were transferred i.v. 1 day prior to B16-OVA melanoma cells s.c implantation into CD45.2+ CD19Cre/+ and TIM-1BKO mice (n=5 mice per group). Tumor-infiltrating OT II cells were examined for expression of IFNγ and FOXP3. Schematic of the experimental and quantitative results are depicted. g, Quantification and representative histogram of IFNAR-1 surface expression of B cells derived from CD19Cre/+ and TIM-1BKO TILs and dLN implanted with B16F10 s.c. (n=5 mice per group). h, Tumor growth in indicated mice implanted with B16F10 melanoma and treated with isotype control (n=3 mice per group) or neutralizing anti-IFNAR-1 antibody (n=4 mice per group). Data are mean ± s.e.m and pooled or representative of at least two to three independent experiments. Repeated measures two-way ANOVA test in d and h. two-tailed Student’s t-test in e, f, and g.