
Extended Data Fig. 1: Total B cells but not plasma cells limit tumor growth and B16F10-infiltrating B cells have a distinct phenotype.
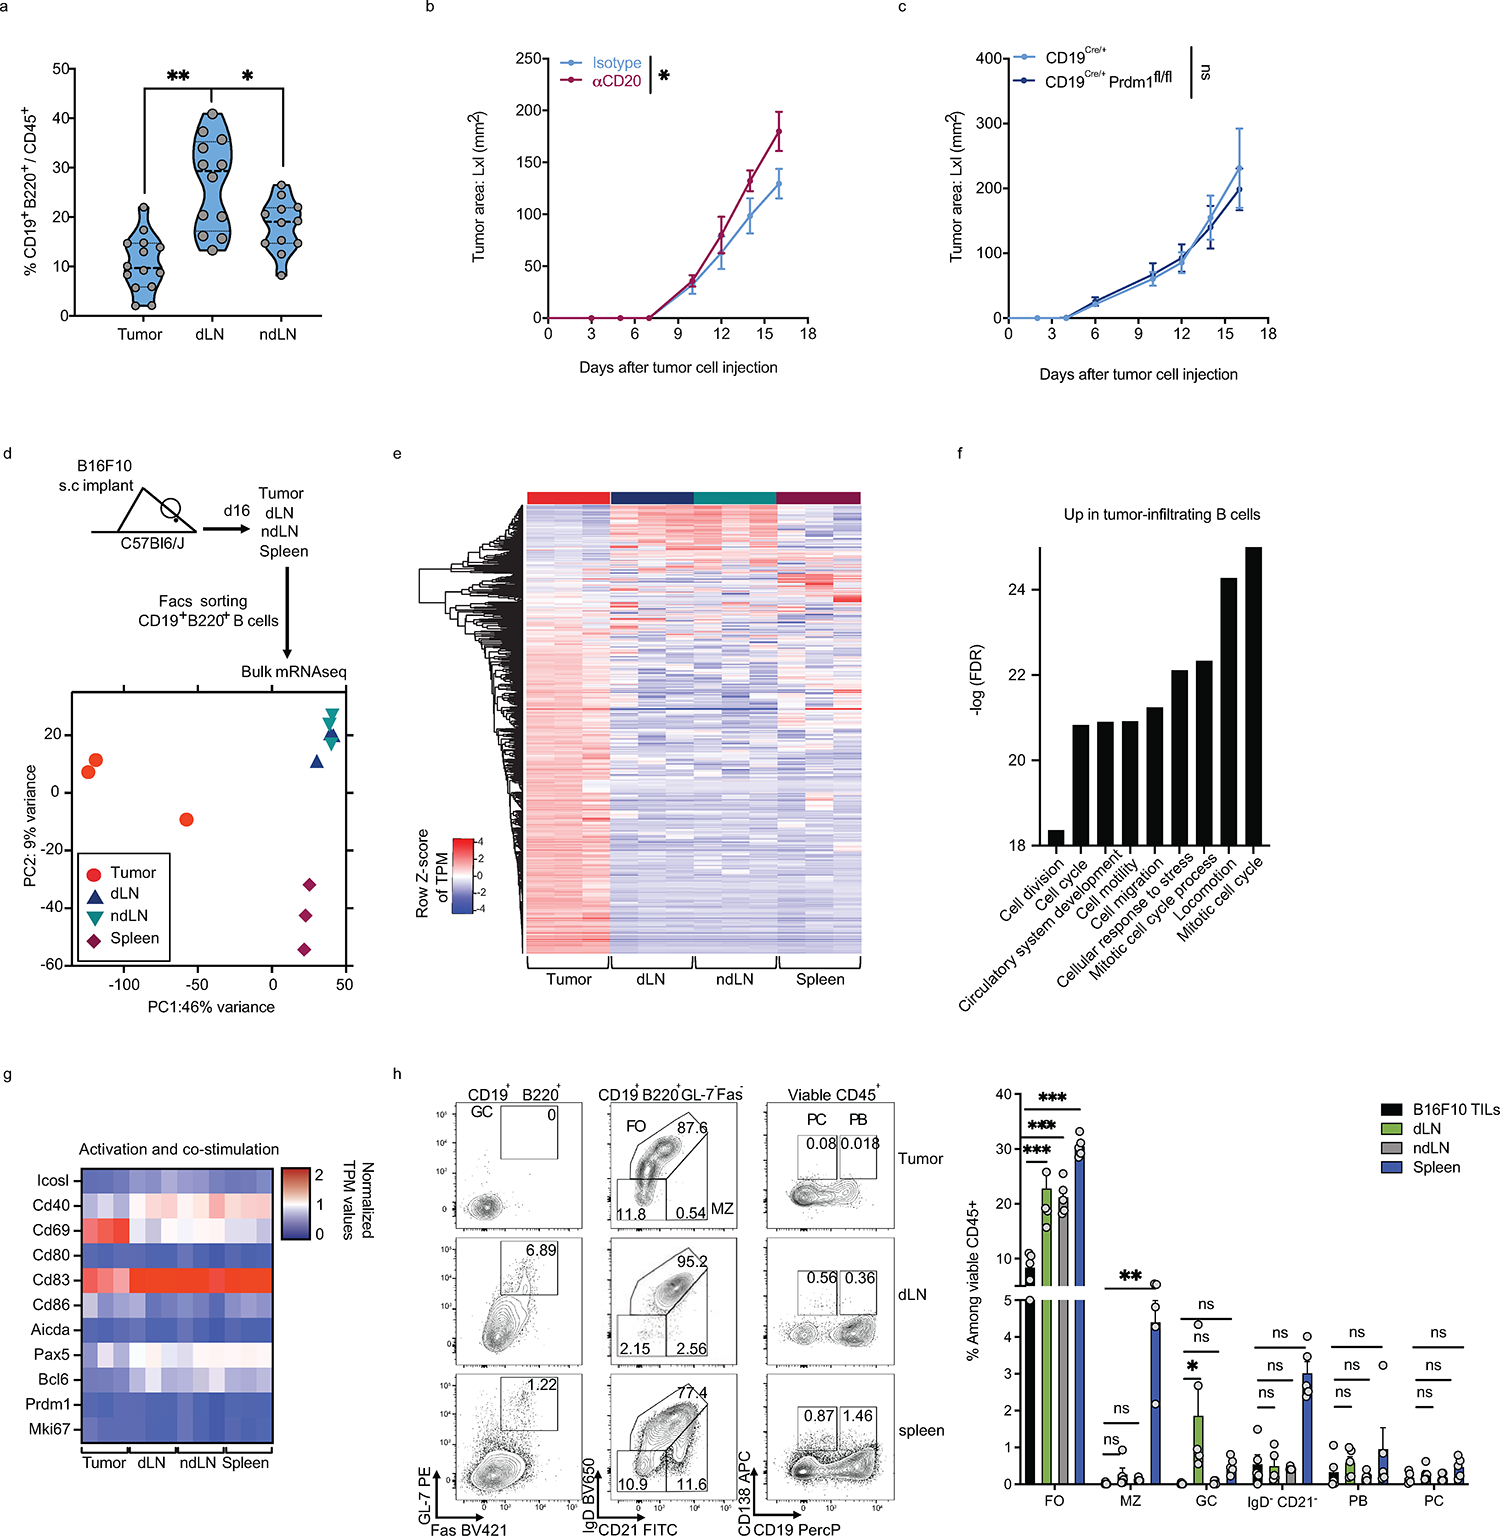
a, Frequencies of B cells among CD45+ cells derived from tumor, dLN, ndLN from C57Bl6/J mice 16 days post tumor implantation. b, c, B16F10 tumor growth in C57Bl/6J treated with anti-CD20 (48h prior to tumor injections) or isotype control antibodies (n=5 mice per group) (b) or CD19Cre/+ and CD19Cre/+xPrdm1fl/fl (n=5 mice per group). d-g, Bulk RNAseq analysis of B cells derived from tumor, dLN, ndLN and spleen of B16F10-bearing wild-type mice (n=3). Experimental design and PCA plot (d), Heatmap of global gene expression (e), Pathway enrichment analysis of genes up-regulated in tumor-derived B cells (f) and heatmap of a selected set of genes (g). h, Flow cytometry analysis of B cells derived from tumor, dLN, ndLN and spleen of C57Bl6/J mice implanted with B16F10 s.c. Representative FACS plot and percentage of B cell subsets. Heatmap depicting the MFI of various B cell markers in B cells derived from tumors or dLN from C57Bl6/J mice (n=5) (h). Data are mean ± s.e.m and pooled or representative of at least two to three independent experiments. * p<0.05, ** p<0.01, *** p<0.0001. Repeated measures two-way ANOVA test in b and c. two-tailed Student’s t-test in a. two-way ANOVA with Tukey's multiple comparisons test in h.