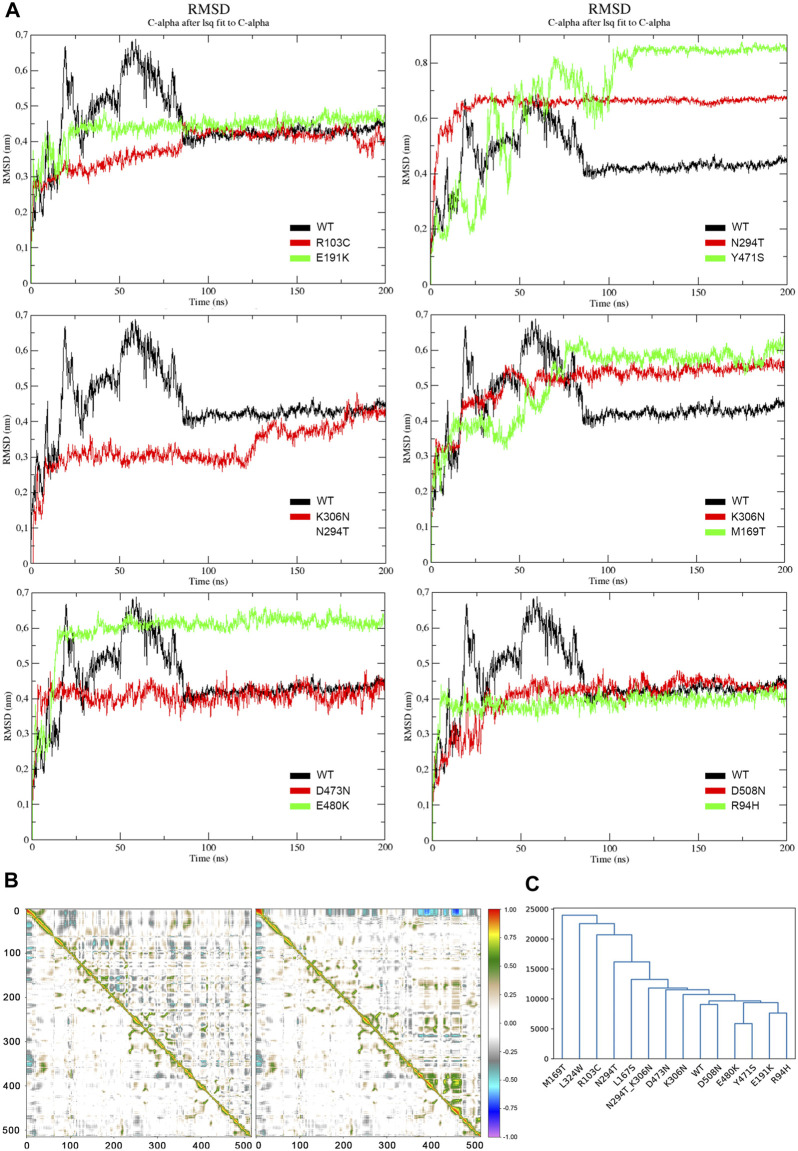
FIGURE 4.
(A) RMSD profiles of the heavy atoms of DHCR24. Each panel compares the wild-type (black) with any two different mutants (in red and green). The double mutant p. [N294T; K306N] is represented alone with the wild-type and is colored in red. (B). DCCMs of p.E191K (left) and p.Y471S. In each DCCM, the lower triangular matrix refers to the wild-type protein’s movements and is provided to ease the direct comparison with the mutants’ movements (upper triangles). Perfect correlations between movements of residues are highlighted in red (direct) or violet (inverse). The residues’ positions in the proteins are reported on the X and Y-axes symmetrically. (C) Clustering analysis of the interaction profiles of DHCR24 with FAD throughout the whole simulation time. The adopted similarity metric is the Euclidean distance.

