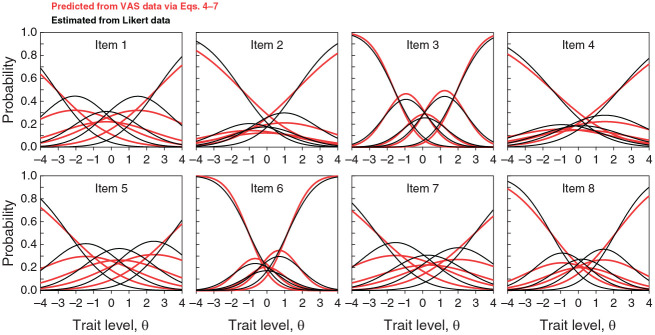
Figure 15.
Category Response Functions for the Items on the ES Scale
Note. Black curves are given by Equation 2 and plotted with NO-GRM parameters estimated from Likert data. Red curves are predictions derived from VAS data using CRM parameters in Equations 4–6, including estimates of discretization boundaries yj,k obtained via Equation 7. ES = excitement seeking; NO-GRM = normal-ogive graded response model; VAS = visual analog scale; CRM = continuous response model.

