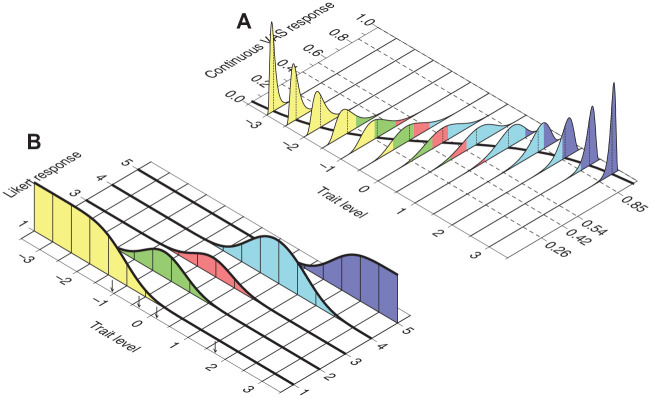
Figure 2.
Transformation of Continuous VAS Responses Into Discrete Likert Responses Over K = 5 Categories for the Item in Figure 1A, With CRM Parameters a = 2, b = 0, and α = 1. Dashed Lines at (y1, y2, y3, y4) = (0.26, 0.42, 0.54, 0.85) in Panel (A) Indicate How the Continuous VAS Dimension is Partitioned into K = 5 Exhaustive and Mutually Exclusive Intervals. By Equation 4, the Probability of a Response Falling in Each Interval at any Given Trait Level is Given by the Area Under the Corresponding Conditional Distribution of Y Within the Corresponding Interval, Indicated with a Different Color for Each Interval. Panel (B) Plots These Probabilities as a Function of Trait Level, Yielding the Item CRFs Under the NO-GRM. Small Vertical Arrows Along the Trait Level Axis Indicate the Resultant NO-GRM Threshold Parameters via Equation 6, Namely,
Note. VAS = visual analog scale; CRM = continuous response model; CRF = category response function; NO-GRM = normal-ogive graded response model.

