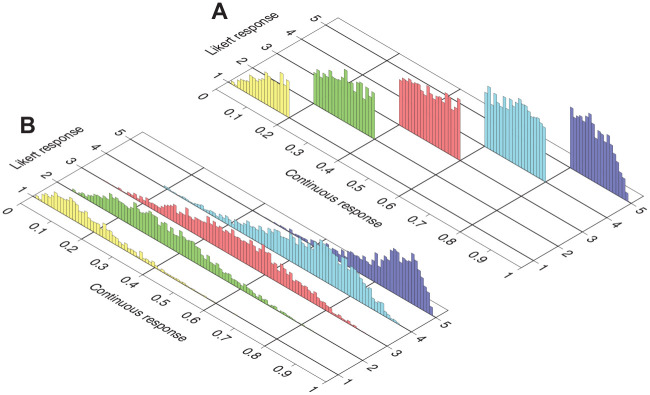
Figure 7.
Correspondence Between Continuous Data and Likert Data Obtained in Two Ways. The Height of Each Individual Bar is Proportional to the Number of Respondents (Out of 10,000 in this Simulation) in Each Bin (0.01 Units in Width) Along the Continuous Dimension in Each Likert Category. (A) Likert Data Obtained by Discretizing Continuous Data with Boundaries (y1, y2, y3, y4) = (0.2, 0.4, 0.6, 0.8), Whose Locations are Immediately Obvious in the Location of the Data. (B) Likert Data Generated by Simulating Discrete Responses to an Item Whose NO-GRM Parameters are Determined From CRM Parameters via Equations 5 and 6 with Boundaries (y1, y2, y3, y4) = (0.2, 0.4, 0.6, 0.8), Whose Locations are Not Immediately Apparent in the Location of the Data. Continuous Responses are the Same in Both Panels and Pertain to Item 4 in the Simulation. True CRM Item Parameters are a4 = 3.316, b4 = −0.288, and α4 = 1.186; Matching NO-GRM Item Parameters for the Generation of Discrete Data in Panel (B) are = 3.316 and . Note that Category Threshold Parameters are Not Equispaced Despite the Equispacing of Discretization Boundaries
Note. NO-GRM = normal-ogive graded response model; CRM = continuous response model.

