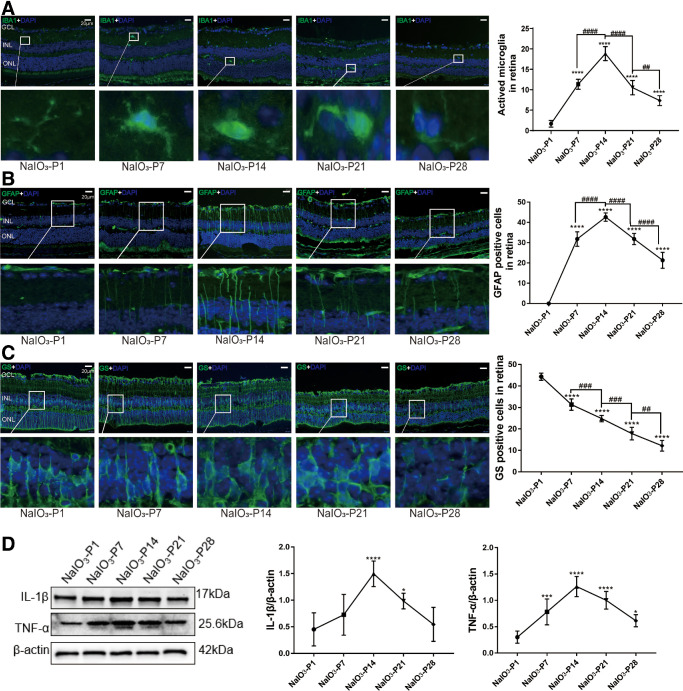
Figure 3.
Neuroglia activation in the RD model. (A) Microglia in the retinas of RD model were labeled with IBA1. The microglia were distributed in IPL and OPL with a ramified shape. At P7, the microglia migrated to the ONL and assumed an “amoeba” shape. Quantification analysis showed that the counts of IBA1 positive cells peaked at P14. (B) The GFAP immunostaining showed that Müller cells were activated to produce glial filaments at P7, and the distribution range of GFAP gradually extended to ONL. The number of GFAP-positive cells increased over time. (C) GS immunostaining decayed progressively after modeling, and the distribution was disordered. (D) Western blot results showed that the IL-1β and TNF-α expressions increased significantly after modeling. (*P < 0.05, **P < 0.01, and ****P < 0.0001, for differences between time points, and #P < 0.05, ##P < 0.01, ###P < 0.001, and ####P < 0.0001, for differences between animal groups, n = 6).

