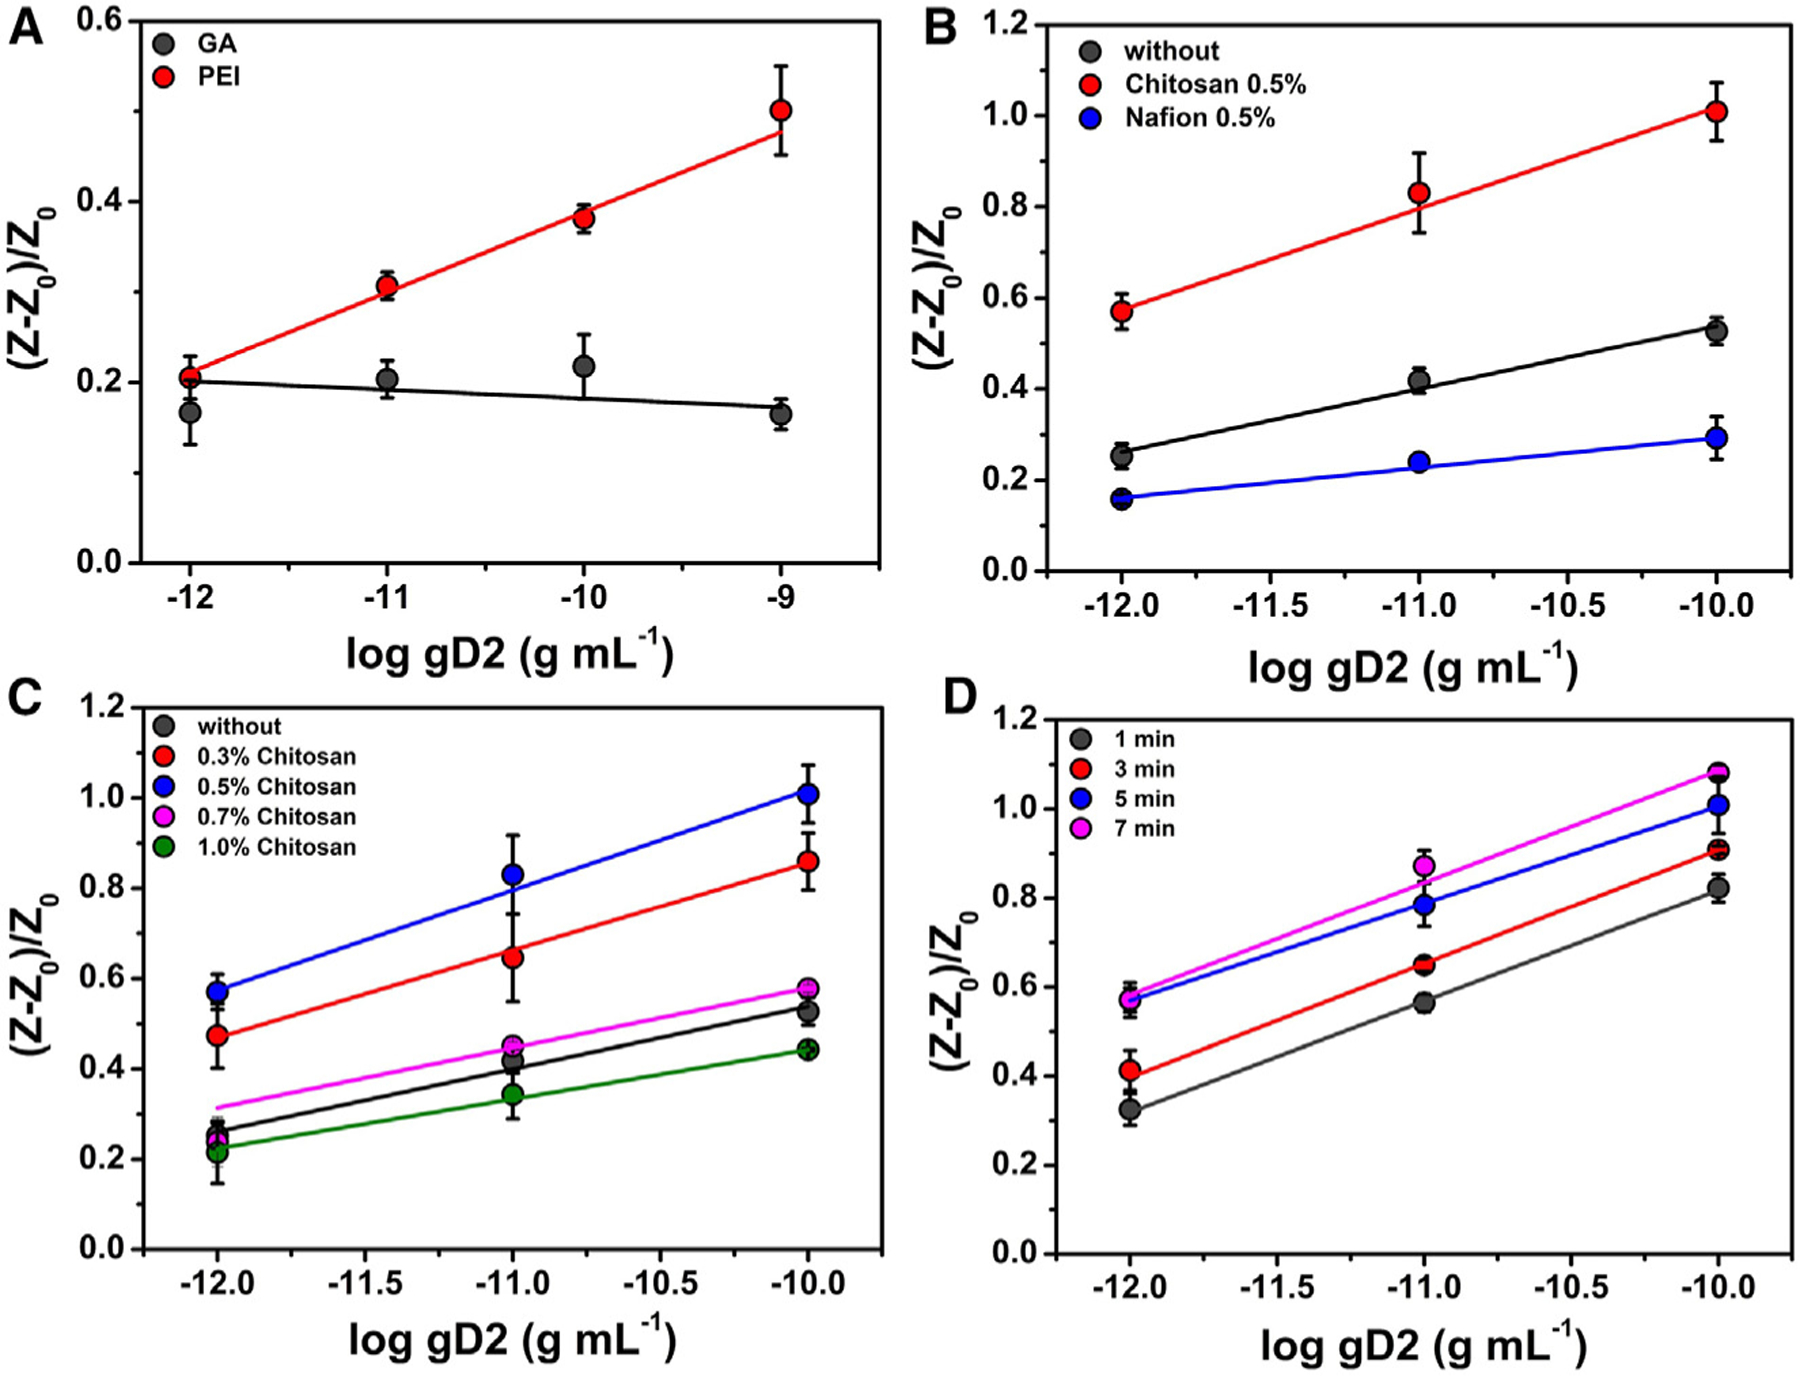
Figure 2. Optimization studies of the herpes virus electrochemical biosensor.

(A) Anchoring of nectin-1 using 25% (m/v) GA (black circles) and 1.0 mg mL−1 PEI (red circles). Optimal results were obtained when the substrate was modified with PEI to enable the anchoring of the nectin-1 receptor through the –COOH terminal group.
(B) Analytical response of the biosensor when fabricated without an additional membrane layer (black circles), modified with 0.5% (m/v) chitosan (red circles), and modified with 0.5% (m/v) Nafion (blue circles). The highest sensitivity was obtained when the biosensor was modified with 0.5% (m/v) chitosan.
(C) Effect of chitosan concentration on biosensor sensitivity: 0.0% (black circles), 0.3% (m/v; red circles), 0.5% (m/v; blue circles), 0.7% (m/v; pink circles), and 1.0% (m/v; green circles). Chitosan at 0.5% (m/v) provided the highest detectability maintaining the lowest reagent-to-usage ratio; thus, this condition was selected for subsequent measurements.
(D) Incubation time experiments between gD2 and the modified electrochemical biosensor. Calibration curves were generated using gD2 at concentrations ranging from 1 pg mL−1 to 0.1 ng mL−1 and incubation times ranging from 1 to 7 min. No significantly increased differences in the detectability of gD2 were observed for incubation periods longer than 5 min; thus, this incubation time was selected for subsequent work. All experiments were carried out at room temperature in triplicate (n = 3) and obtained through calibration curves for gD2 at a concentration range between 1.0 pg mL−1 and 0.1 ng mL−1. The error bars correspond to the standard deviation. All EIS measurements were recorded at open circuit potential at the frequency range of 1 3 105 Hz to 0.1 Hz and using an amplitude of 10 mV in the following medium: 5 mmol L−1 [Fe(CN)6]3−/4− in 0.1 mol L−1 KCl solution.
