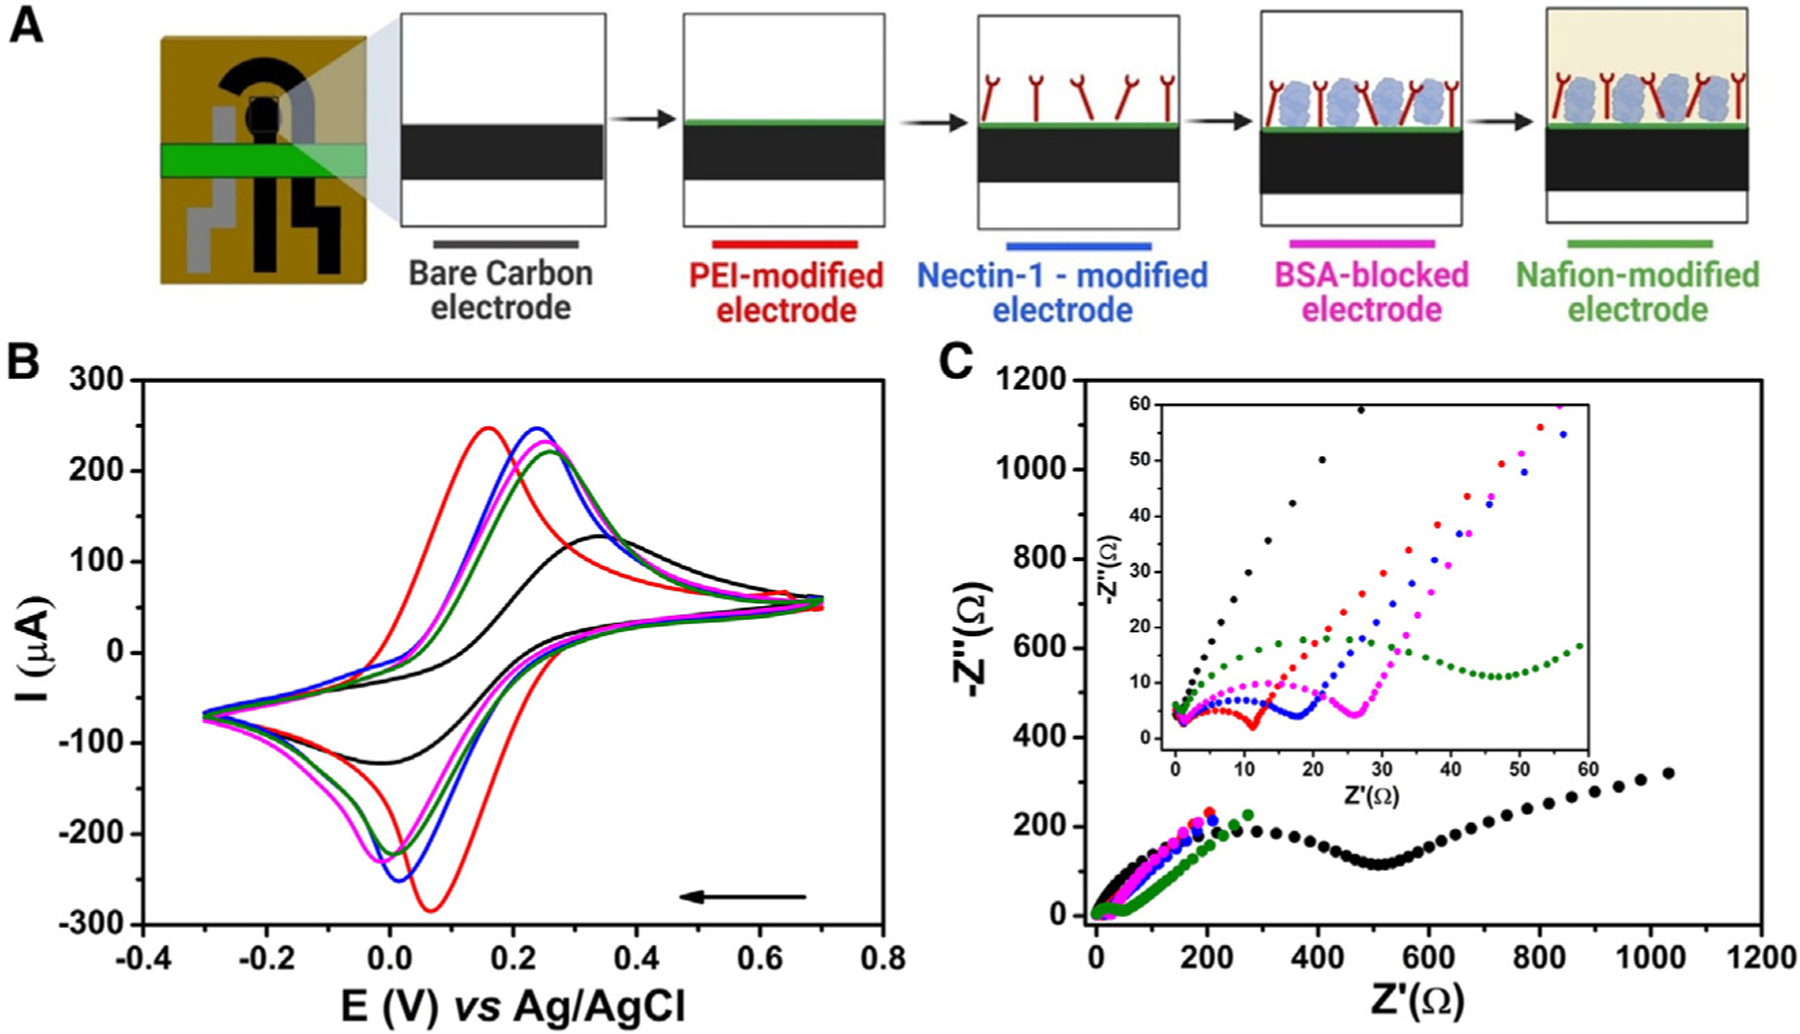
Figure 3. Functionalization steps and electrochemical characterization of the biosensor.

(A) Schematic representation of the stepwise functionalization of the electrochemical biosensor.
(B) CV experiments were recorded for each modification step made to the biosensor surface in a solution of 5.0 mmol L−1 [Fe(CN)6]3−/4− containing 0.1 mol L−1 KCl as the supporting electrolyte. A potential window from −0.3 V to 0.7 V and a scan rate of 50 mV s−1 were used.
(C) Nyquist plots were obtained using the same conditions as those shown in (A). Inset shows a zoomed-in view of the plots at high-frequency regions. Conditions used were frequency range from 1 × 10⁵ Hz to 0.1 Hz and 10 mV amplitude. Measurements were performed at room temperature. The colors displayed in the CV and Nyquist plots correspond to each modification step outlined in (A). This figure was partially created in BioRender.com.
