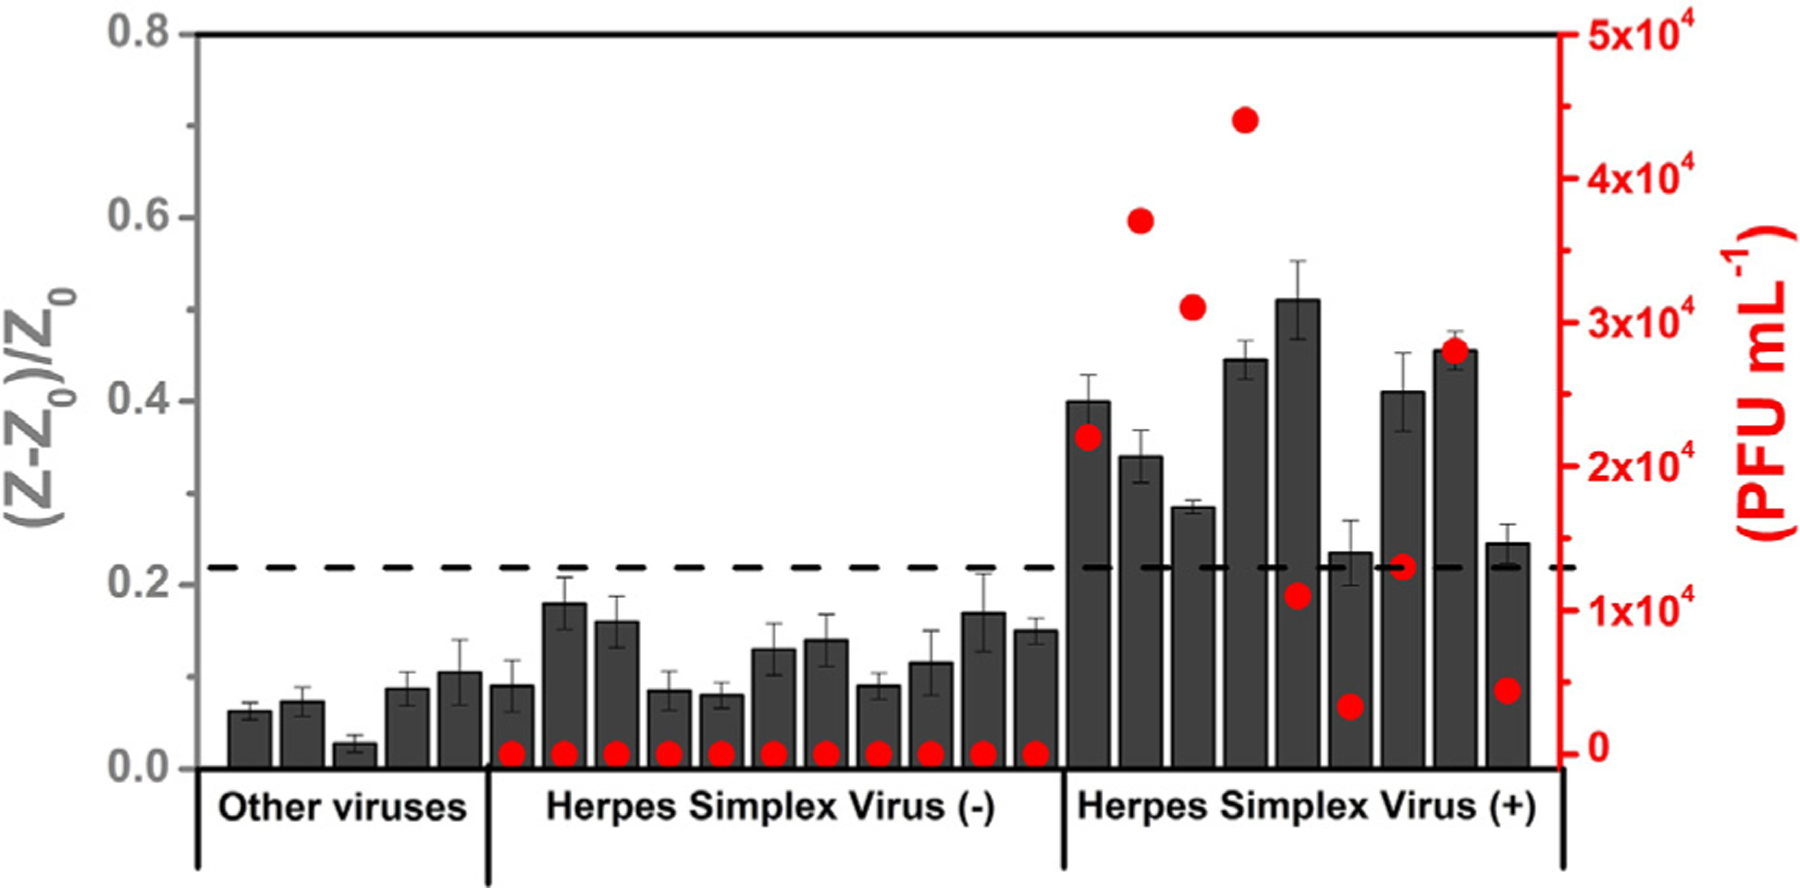
Figure 5. Detection of HSV-2 in biofluid samples from guinea pigs.

Comparison of the electrochemical biosensor response (normalized RCT values) obtained for the cross-reactivity studies (other viruses) in VTM and the analyses of 20 guinea pig vagina samples in DMEM (11 HSV-2 negative and 9 HSV-2 positive) (dark gray bars) and quantification of the HSV-2-positive samples obtained using the conventional titrated method (red circles) and shown as PFU mL−1. The dotted line indicates the cutoff value of the normalized RCT response established to indicate whether the sample was identified as positive for HSV-2 by our biosensor. All electrochemical measurements were recorded in triplicate (n = 3), and the error bars correspond to the standard deviation.
