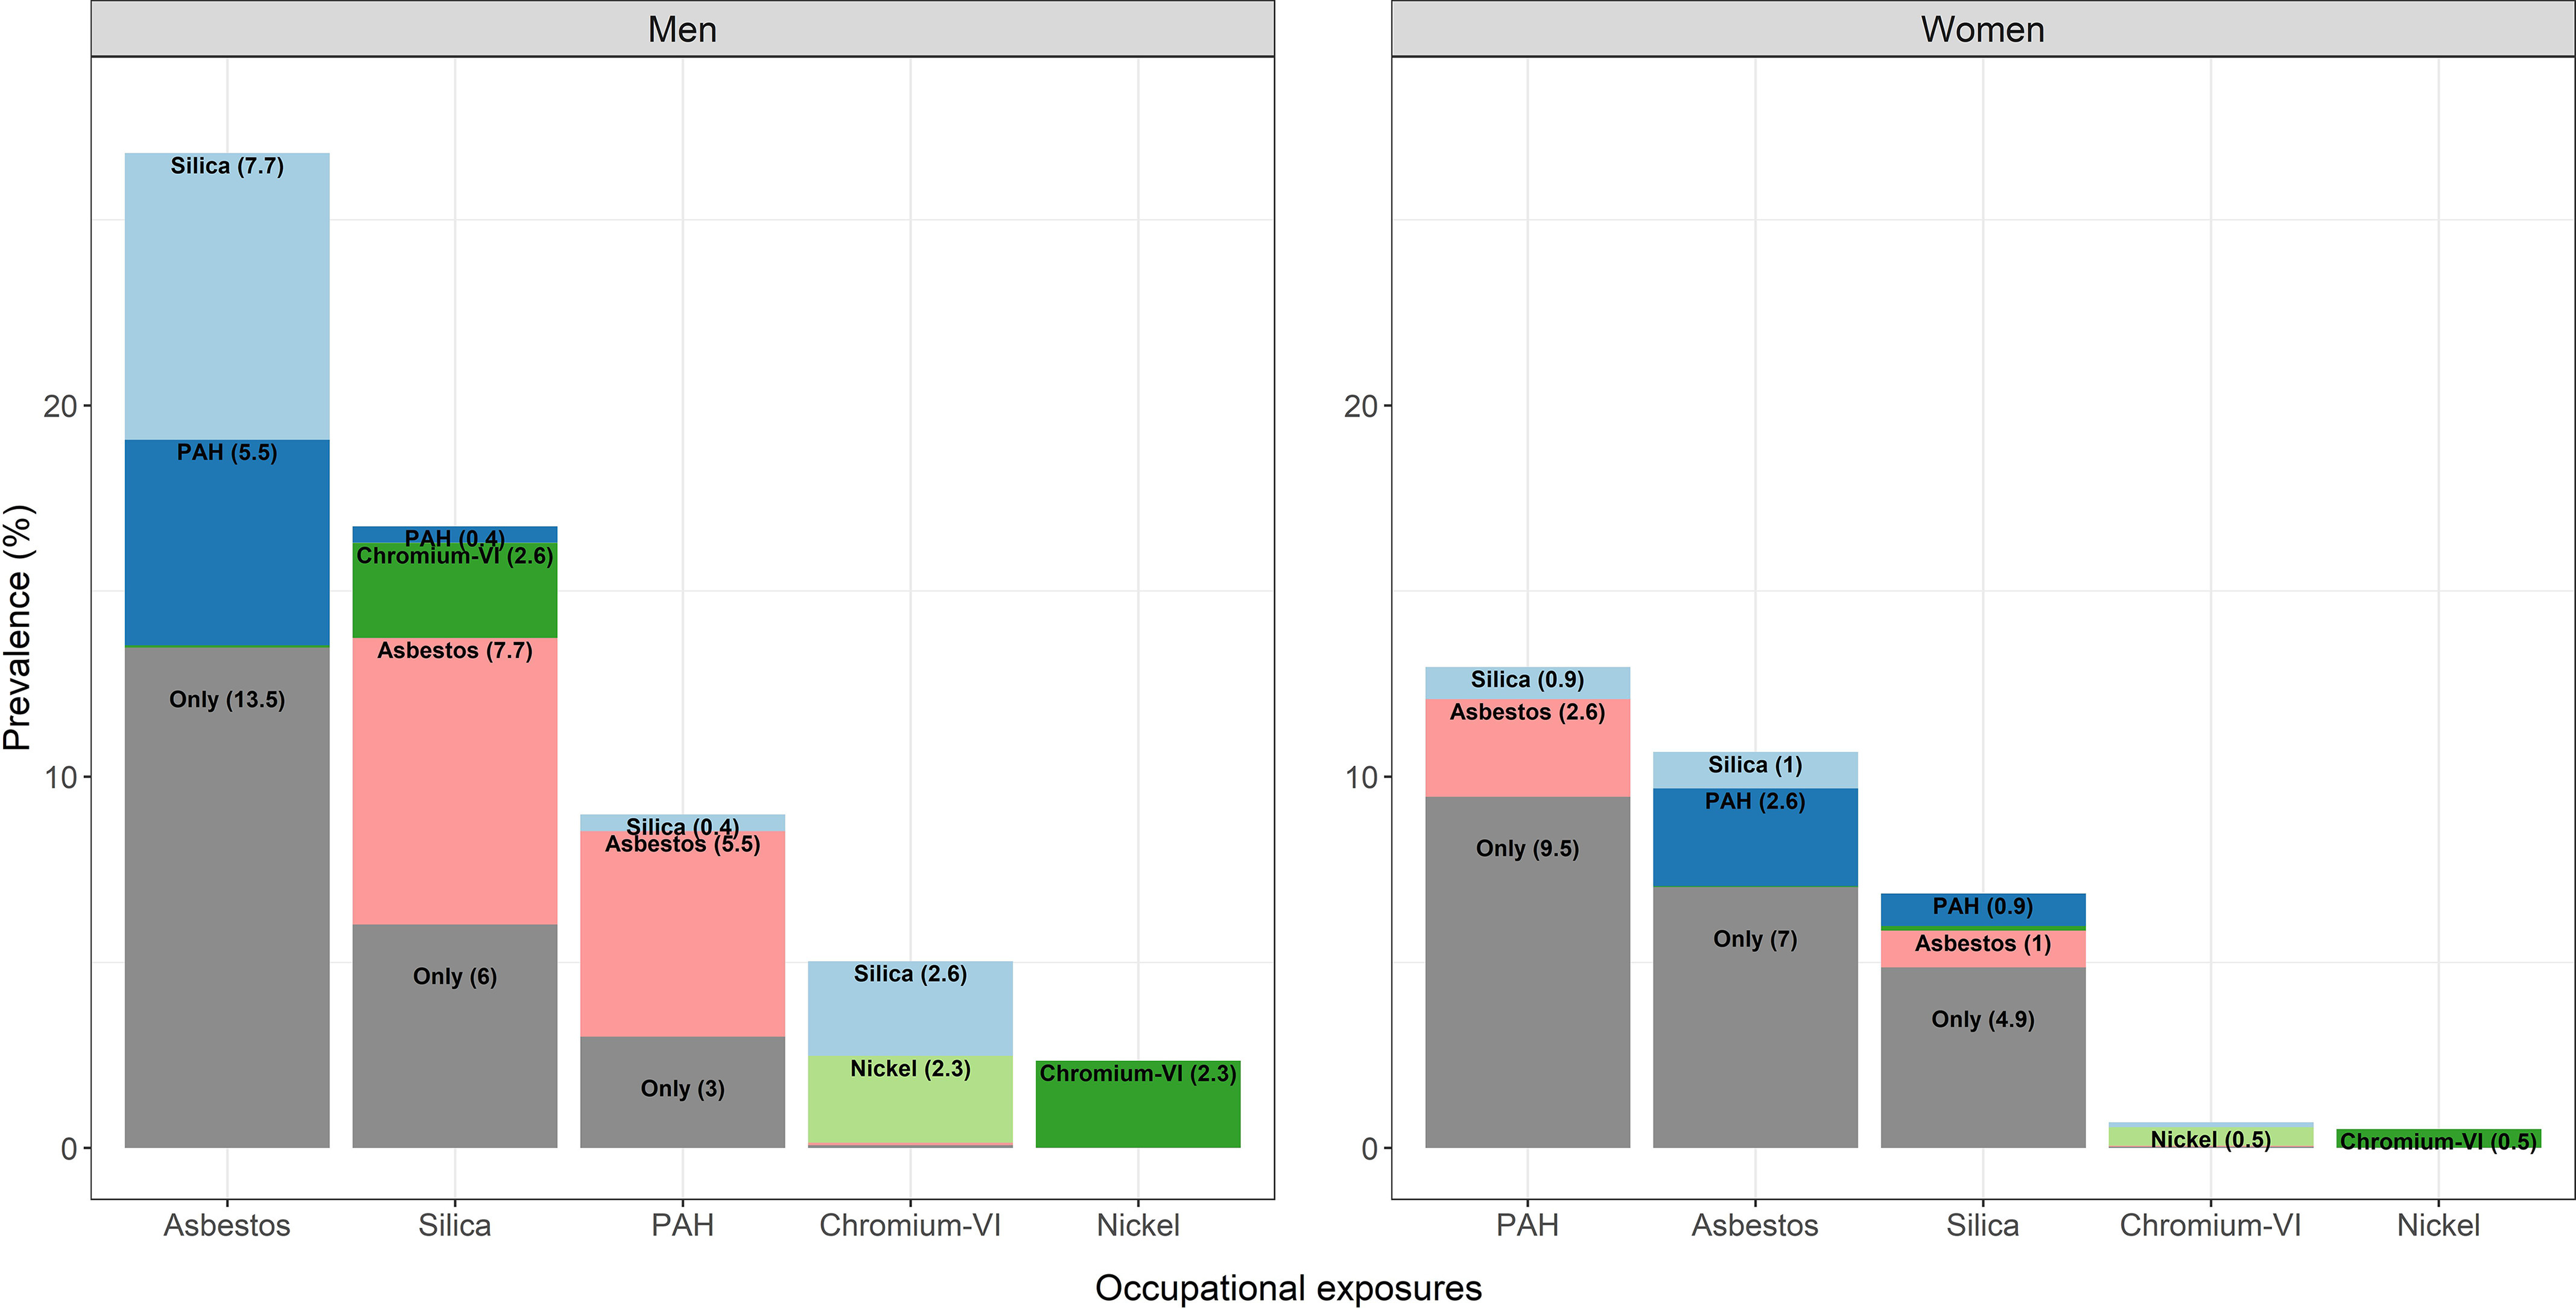
Figure 1.

Prevalence of occupational exposure to asbestos, silica, PAH, chromium-VI, and nickel among SYNERGY study participants with one or two exposures ( men, women). The total of the columns represents the overall—individual plus co-exposed—prevalence of each exposure, while within the column the proportion of “co-exposure” to each of the other exposures is also shown. Percentages lower than 0.4% are not displayed because of lack of visibility. Note: PAH, polycyclic aromatic hydrocarbons.
