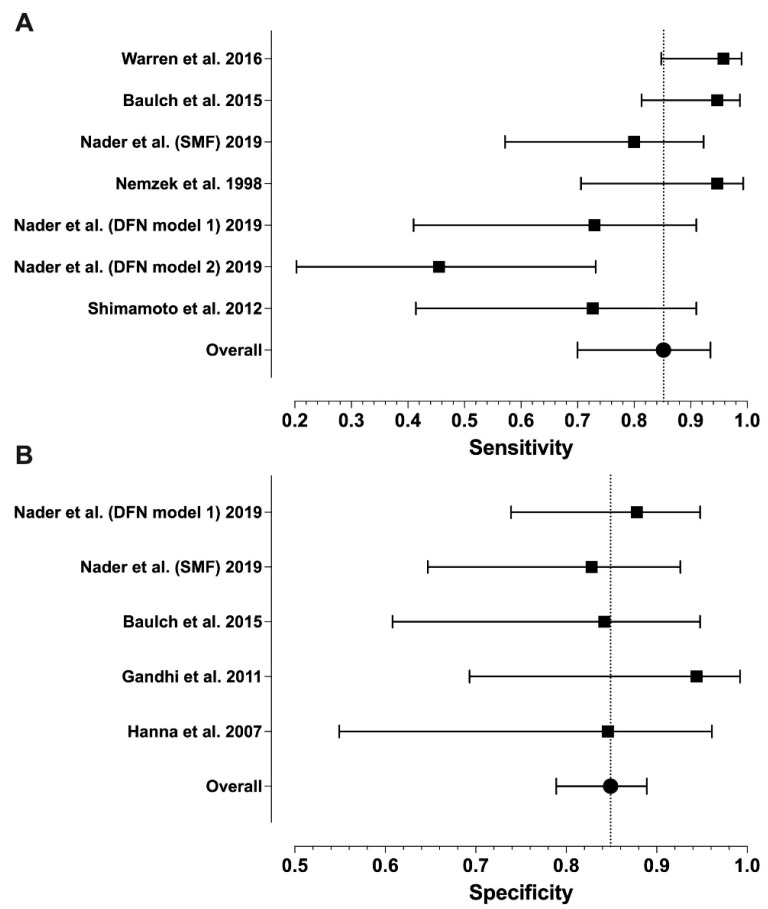
Figure 2.
Forest plots of the sensitivity (A) and specificity (B) values from individual studies and their model-based estimates. Bars represent 95% confidence intervals, and dotted lines represent the model-based estimates. Data shown from original publications: (A) [19,21,22,28,30], (B) [16,19,20,21].

