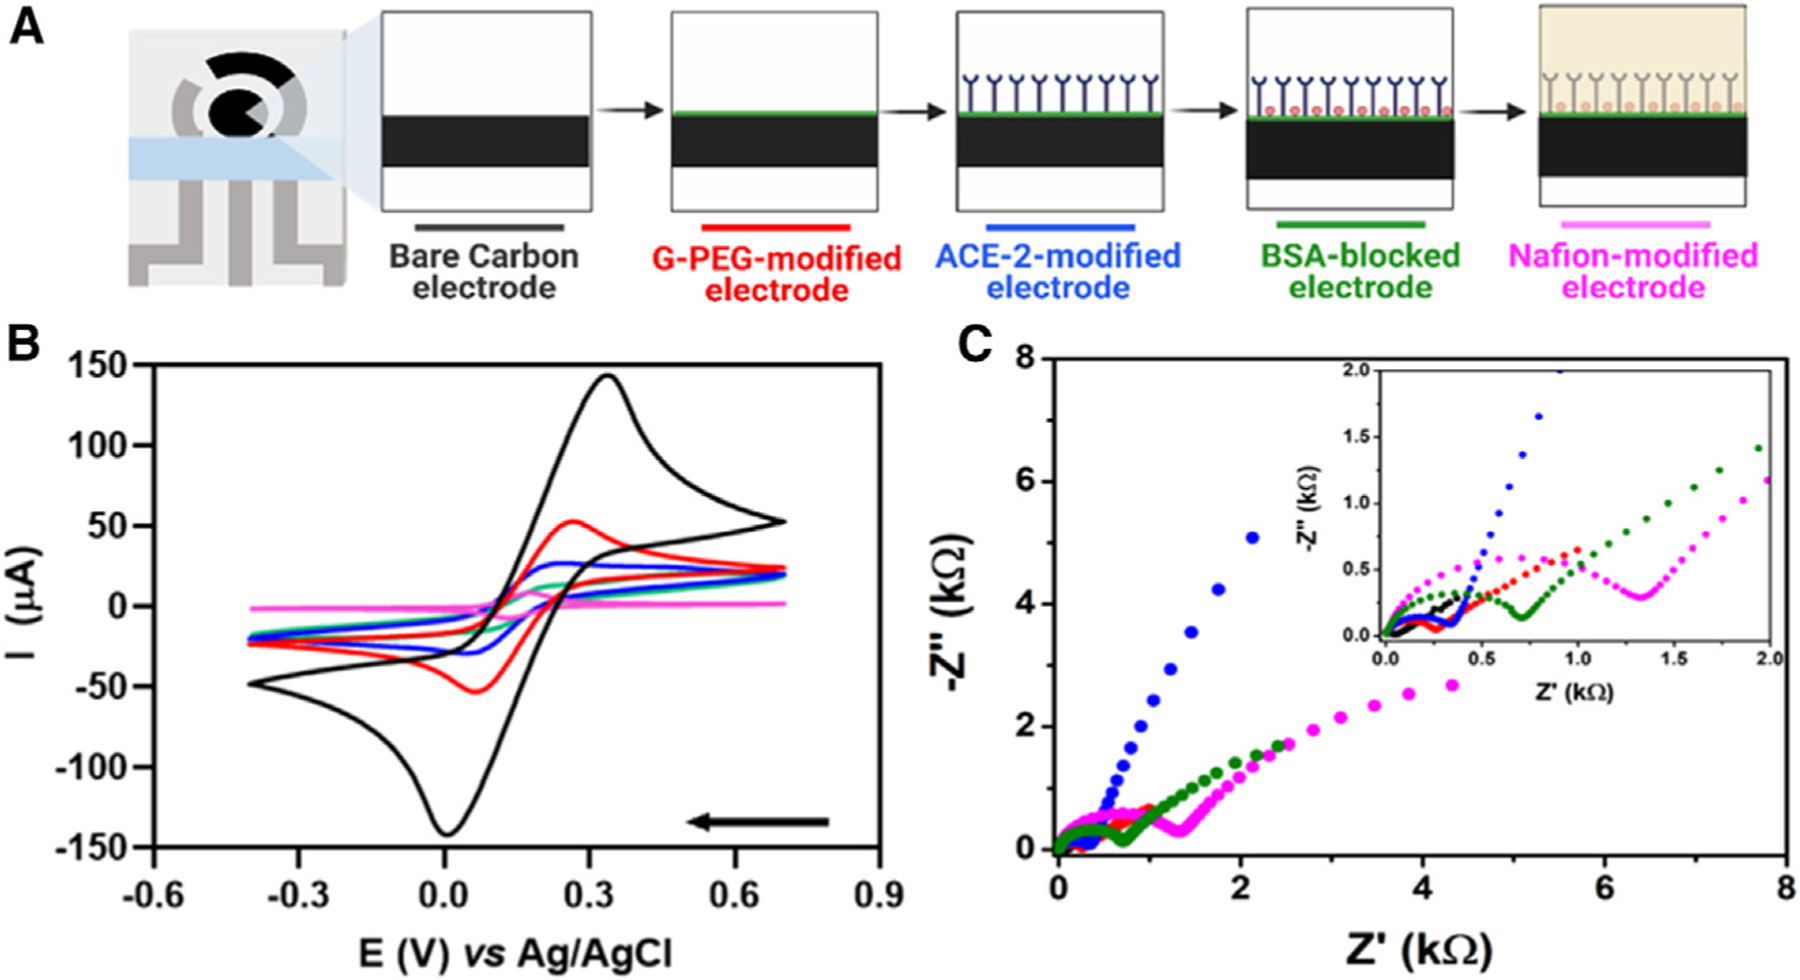
Figure 2. Electrochemical behavior of the eco-friendly bacterial cellulose-based biosensor.

(A)Schematic representation of stepwise functionalization of the electrochemical biosensor.
(B) CVs recorded using different electrodes at each functionalization step of the electrochemical biosensor using 5.0 mmol L−1 [Fe(CN)6]3−/4− containing 0.1 mol L−1 KCl as supporting electrolyte in a potential window ranging from −0.4 to 0.7 V at a scan rate of 50 mV s−1.
(C) Nyquist plots were obtained in the same experimental conditions as used for (B). Inset shows a zoomed-in view of the plots at high-frequency regions. Conditions: frequency range from 1 × 10⁵ Hz to 0.1 Hz and amplitude of 10 mV; measurements were performed at room temperature. The colors displayed in the CVs and Nyquist plots are related to each step modification illustrated in (A).
(A)Created in BioRender.com.
