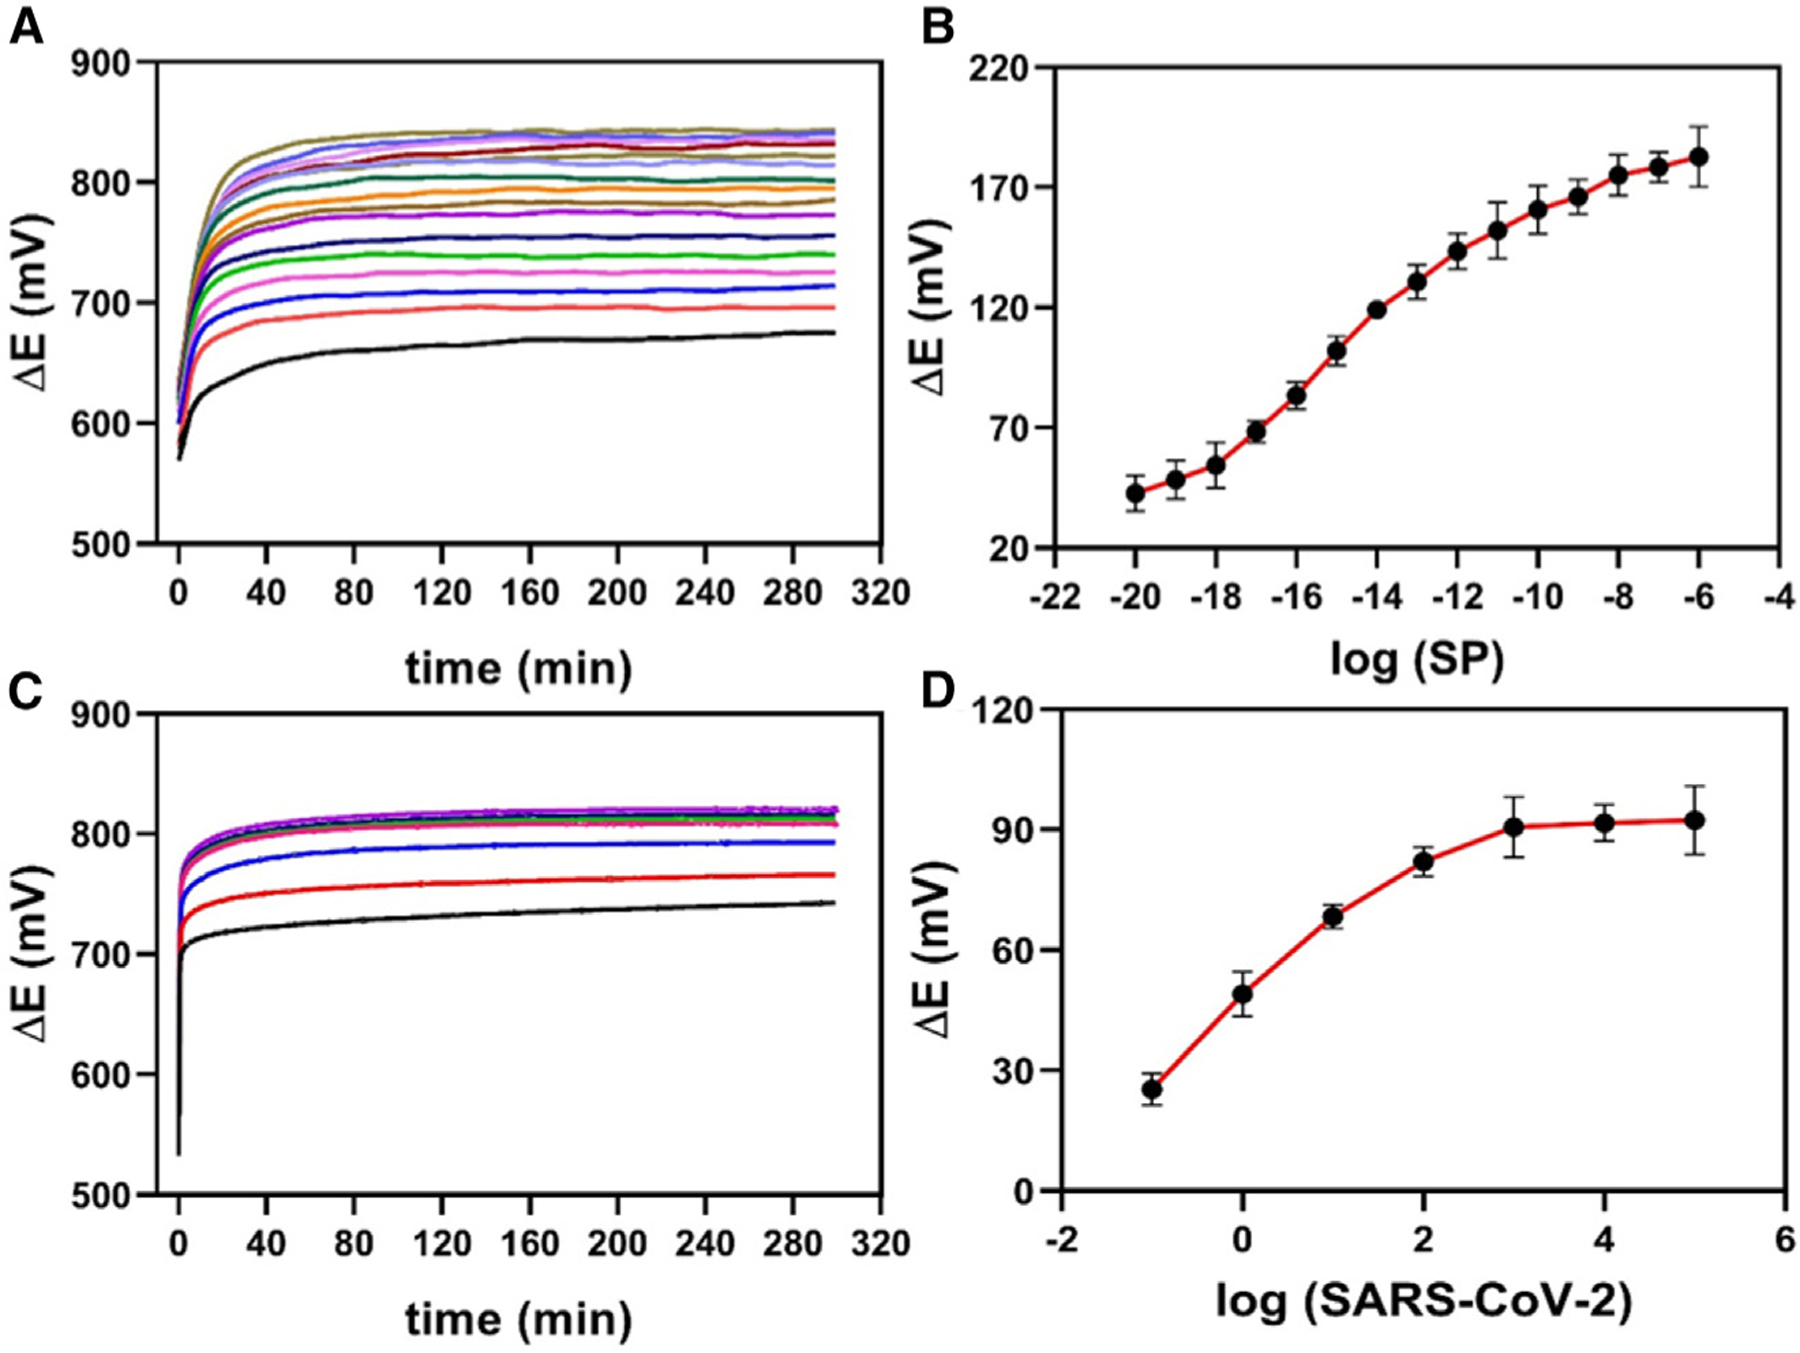
Figure 4. Potentiometric measurements and dose-response curves for SARS-CoV-2 detection.

(A) Potentiometric responses of the BC-based biosensor for concentrations ranging from 10.0 zg mL−1 to 1.0 mg μL−1 SARS-CoV-2 SP in 0.1 mol L−1 PBS (pH = 7.4).
(B) Dose-response curve obtained from ΔE (V) values, subtracted from the blank values (ΔE (V) = Esample – Eblank), as a function of the logarithm of the SP concentration.
(C) Potentiometric responses for SARS-CoV-2 detection in a concentration range from 1 × 10⁻¹ copies μL−1 to 1 × 10⁵ copies μL−1.
(D) Dose-response curve obtained from ΔE (V) values, subtracted from the blank values (ΔE (V) = Esample — Eblank), as a function of the logarithm of the SARS-CoV-2 concentration. All potentiometric measurements were carried out after the incubation (7 min) of 10 mL of SP or SARS-CoV-2 samples on the surface of the BC-based biosensor. The measurements were recorded in triplicate (n = 3) in 0.1 mol L−1 PBS medium for 300 s, and the error bars correspond to the standard deviation.
