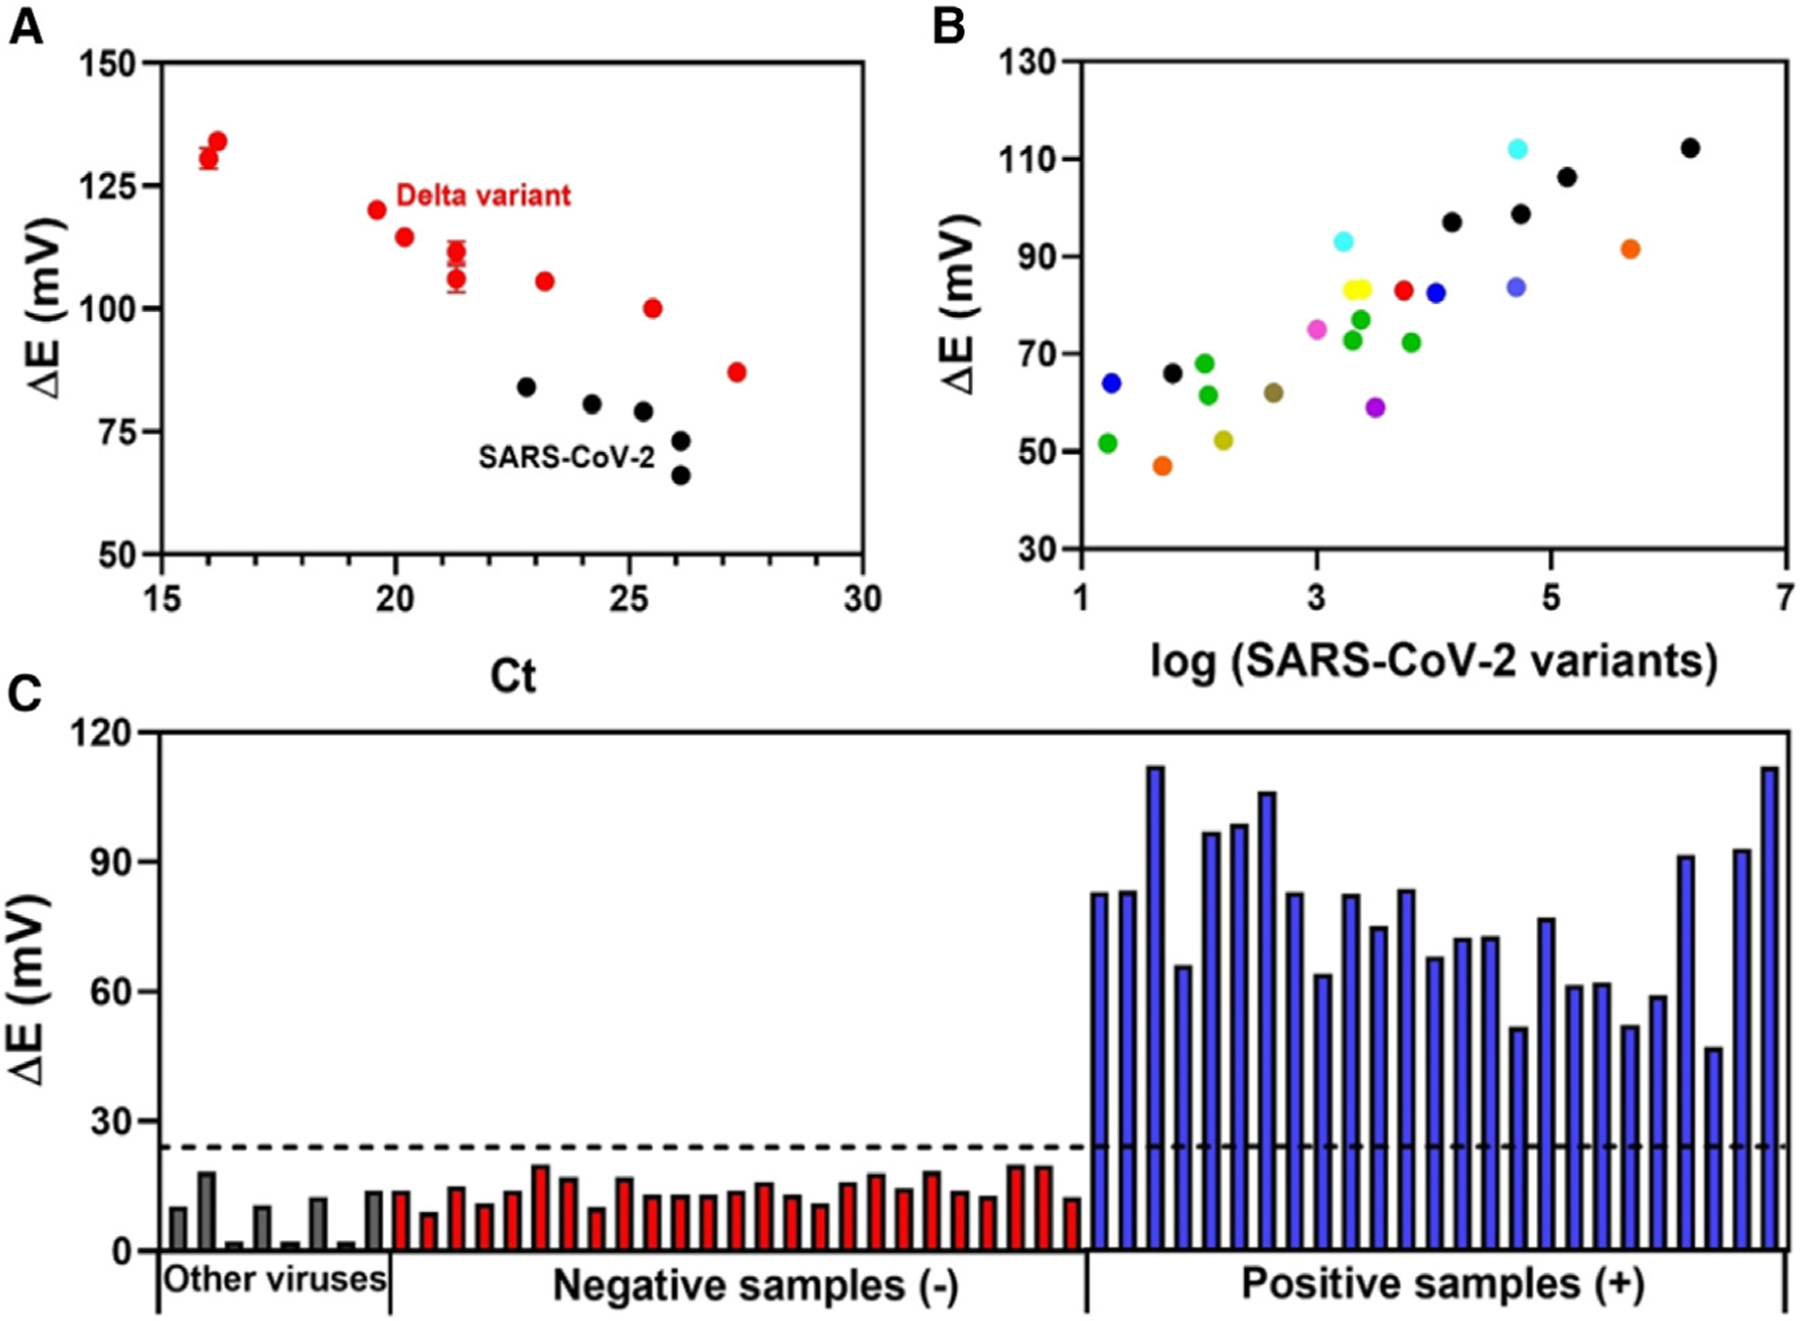
Figure 5. Electrochemical detection of SARS-CoV-2 variants in human NP/OP biofluid samples.

(A) Electrochemical response obtained for five clinical samples containing original SARS-CoV-2 strain (black circles) and 10 clinical samples containing SARS-CoV-2 Delta variant (B.1.617.2, red circles) as a function of Ct values. All measurements were recorded in triplicate (n = 3), and the error bars correspond to the standard deviation.
(B) Potential difference, ΔE, obtained using the modified electrode for another 12 lineages of SARS-CoV-2 as a function of the RNA concentration (copies μL−1) provided by the RT-PCR method,  B.1,
B.1,  B.1.291,
  B.1.369,
  B.1.340,
  B.1.243,
  B.1.311,
  B.1.1.304,
  B.1.1.317,
  B.1.2,
  B.1.1.7,
  B.1.240, and
  B.1.350.
(C) Comparison of the electrochemical response obtained by the cross-reactivity studies (gray bars), 25 SARS-CoV-2-negative clinical samples (red bars), and 25 positive SARS-CoV-2 clinical samples containing different lineages (blue bars). The dotted line indicates the cutoff value of ΔE (V) (ΔE (V) = Esample − Eblank) response established to indicate whether the sample was positive for SARS-CoV-2 variants as determined by our biosensor.
