
Figure 3. Developmental refinement of fiber covariance networks.
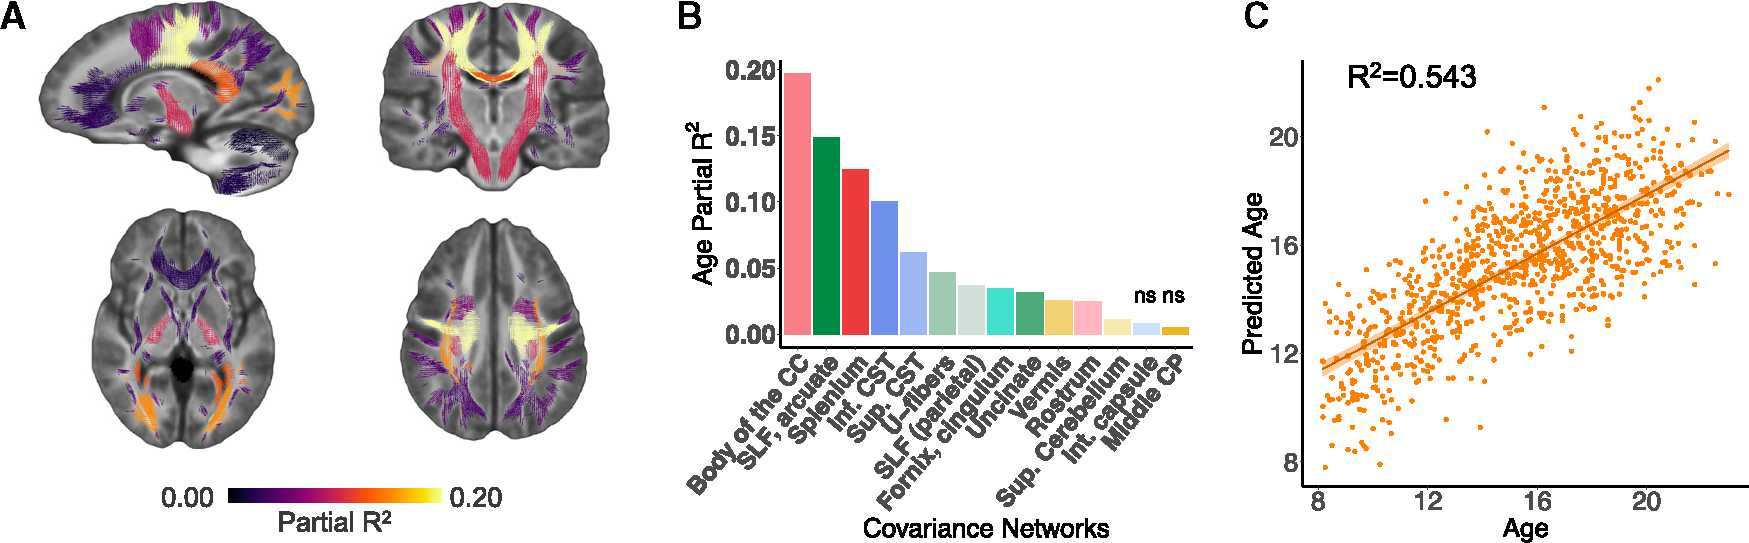
(A) Mass-univariate analyses using GAMs revealed that age was associated with significant changes in FDC in 12 of 14 networks. The coloring of the fixels of the covariance networks is based on the variance explained (partial R2). Multiple comparisons were accounted for using the FDR (q < 0.05).
(B) Bar graph depicting the effect size (partial R2) of the developmental effect for each network. The greatest effect sizes were seen in networks such as the body of the corpus callosum (CC), the superior longitudinal (SLF) and arcuate fasciculi, and the splenium of the CC (networks 6 and 5 and 1). Nonsignificant associations are marked by “ns.”
(C) We tested whether the multivariate signature of fiber covariance networks could predict age above and beyond sex and data quality by comparing a full model to a null model excluding the 14 covariance networks. We found a significant difference between a reduced covariate-only model (i.e., sex, motion, and image quality) and a full model that included both the fiber covariance networks and covariates (F = 76.3, df = 14, p < 0.001). The proportion of variance in age explained by the 14 covariance networks was R2 = 0.543, resulting in a good correspondence between age and predicted age. CST, corticospinal tract; CP, cerebellar peduncle; Int, internal; Sup, superior.