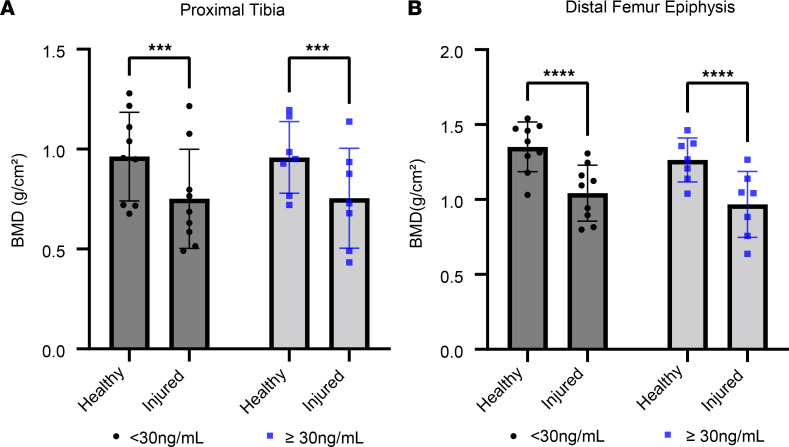
Figure 8. Comparable bone mineral density (BMD) loss in participants with study 25(OH)D less than 30 ng/mL and 25(OH)D less than 30 ng/mL.
The figure shows BMD from the final 6-month DXA scan from the injured (surgical) and healthy (nonsurgical) limbs. (A) BMD in proximal tibia. (B) BMD in distal femur. All participants showed lower BMD in the injured limb at the 6-month follow-up and there were no differences between groups (n = 9 and 7 for low- and high-status groups, respectively). Full-factorial repeated-measures ANOVA; results of post hoc tests on graph. ***P < 0.001, ****P < 0.0001.

