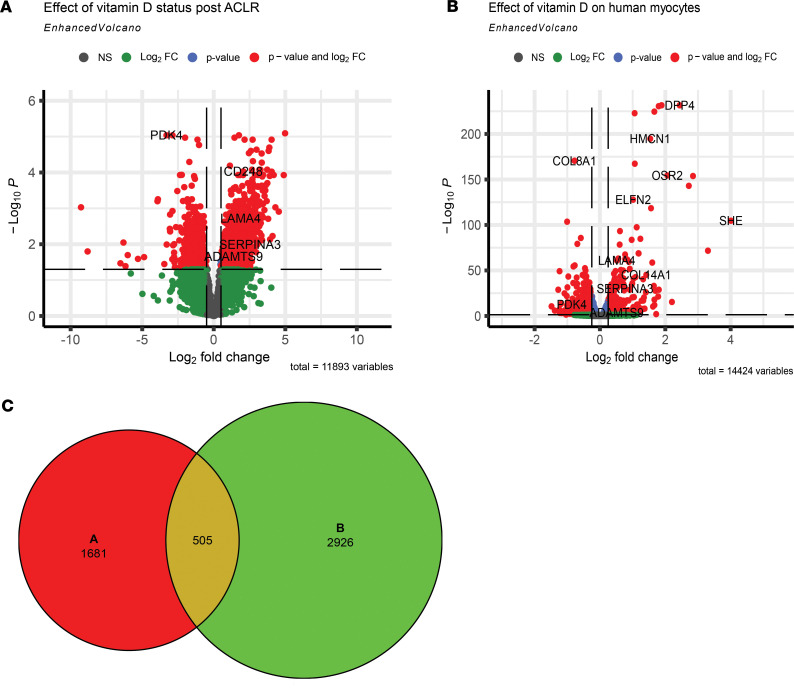
Figure 9. Identification of genes responsive to vitamin D status after ACL reconstruction (ACLR).
(A) Volcano plots of DEGs from analysis of RNA-seq data sets comparing low and high vitamin D status groups 1 week after ACLR log2-transformed fold change (Log2FC) cutoff was set at ±1 (2-fold up and down). Green represents genes that did not reach statistical significance (adjusted P < 0.05). Blue represents genes that were statistically significantly different but did not change more than the fold change cutoff. Red represents DEGs meeting both statistical and fold change cutoffs. (B) Vehicle- and 1,25(OH)2D3-treated human primary myocytes. (C) Venn diagram showing the DEGs from B and C, with 505 common to both.

