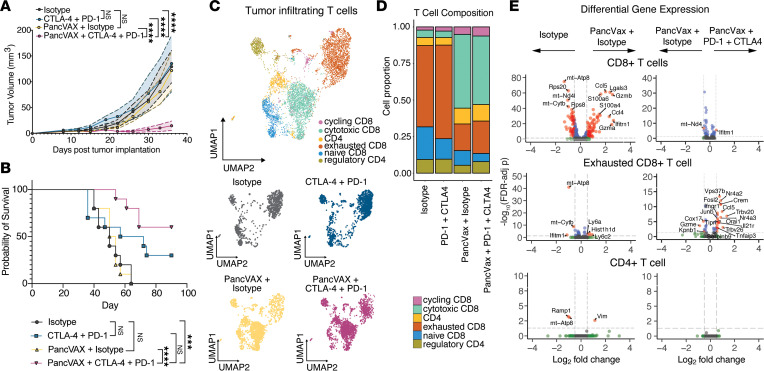
Figure 1. PancVAX plus ICIs elicit antitumoral CD8+ T cell immunity with minimal effect on CD4+ T cells.
C57BL/6 mice were implanted with 1 × 10⁶ Panc02s s.c. and vaccinated with PancVAX, s.c. tail base on days 12 and 19. At day 12, mice received 100 µg anti–PD-1, i.p., or isotype twice weekly with 2 doses of 100 µg anti–CTLA-4 or isotype, i.p., on days 15 and 19. (A) Tumor volumes were measured in mice treated with isotype (gray), anti–CTLA-4, and–PD-1 (blue), PancVAX with isotype (yellow), and PancVAX with anti–CTLA-4 and PD-1 (magenta). Shaded regions represent data as mean ± SEM. P values derived from 2-way ANOVA with Tukey’s multiple-comparison test (****P ≤ 0.0001). (B) Survival analysis. P values derived from Log-rank (Mantel-Cox) (***P ≤ 0.001, ****P ≤ 0.0001). (C) Uniform manifold approximation plot (UMAP) of 6,423 T cells from Panc02 tumors (day 35). Cells annotated as cycling T cells (pink), cytotoxic CD8+ T cells (teal), effector CD4+ T cells (gold), exhausted CD8+ T cells (orange), naive CD8+ T cells (blue), and regulatory T cells (olive). UMAP of distribution of T cell populations across groups: Isotype control (gray), anti–CTLA-4, and anti–PD-1 (blue), PancVAX with isotype (yellow), and PancVAX with anti–CTLA-4 and PD-1 (magenta). (D) Stacked bar plot of the proportions of T cell phenotype across groups. (E) Volcano plots of MAST tests for differential expression between Isotype control- and PancVAX-treated, PancVAX + Isotype–treated, and PancVAX + anti–PD-1 + anti–CTLA-4–treated CD8+ T cells in total (top), exhausted CD8+ T cells (middle), and CD4+ T cells (bottom). Genes with significant FDR-adjusted P values (adjusted P < 0.05) and average log2-fold changes (|log2FC| > 0.5) are colored red.

