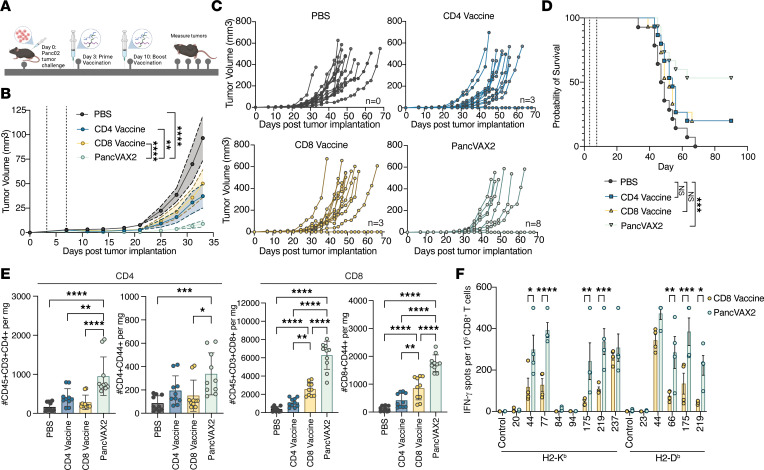
Figure 3. PancVAX2 improves control of tumor growth and long-term survival associated with an increase in tumor infiltrating T cells.
(A) C57BL/6 mice were implanted with 3 × 10⁶ Panc02s, s.c., on day 0. Mice were vaccinated s.c. at base of tail on days 3 and 10 with PBS (n = 14) or CD4 Vaccine, CD8 Vaccine, or PancVAX2 (n = 15). (B) Average tumor volumes were plotted until day 33. Data shown as mean ± SEM. Significance on day 33 calculated by 2-way ANOVA followed by Sidak’s multiple-comparison test. (C) Spider plots of individual growth curves. Number of tumor free mice at day 70: PBS (n = 0), CD4 vaccine (n = 3), CD8 vaccine (n = 3), PancVAX2 (n = 8). (D) Kaplan-Meier survival curves. Vaccination time points shown as gray dashed line. Significance calculated by Log-rank (Mantel-Cox) test. (E) C57BL/6 mice implanted with 3 × 10⁶ Panc02s, s.c., on day 0. Mice were vaccinated s.c. on day 14 and 21 with PBS, CD4 Vaccine, CD8 Vaccine, or PancVAX2 (n = 5). On day 28, tumors were harvested, dissociated into a single-cell suspension, and analyzed by flow cytometry. Total CD4 and CD8 or activated (CD44+) CD4 and CD8 populations per mg tumor were quantified from the CD45+CD3+CD19-NK1.1– population. Symbols represent technical duplicate of individual mice. (F) C57BL/6 mice were implanted with 3 × 10⁶ Panc02s, s.c., on day 0. Mice were vaccinated s.c. on day 28 with PBS or CD4 Vaccine, CD8 Vaccine, or PancVAX2 (n = 4). On day 35, tumors were harvested, and CD8 T cells were isolated and cocultured in an IFN-γ capture plate at a 1:1 ratio with T2-H2-Kb or T2-H2-Db APCs pulsed with 5 µg/mL MHCI peptides for 24 hours. Symbols represent individual mice. Data are shown as mean ± SD. Significance was calculated by 2-way ANOVA followed by Sidak’s multiple-comparison test. *P ≤ 0.05, **P ≤ 0.01, ***P ≤ 0.001, ****P ≤ 0.0001.

