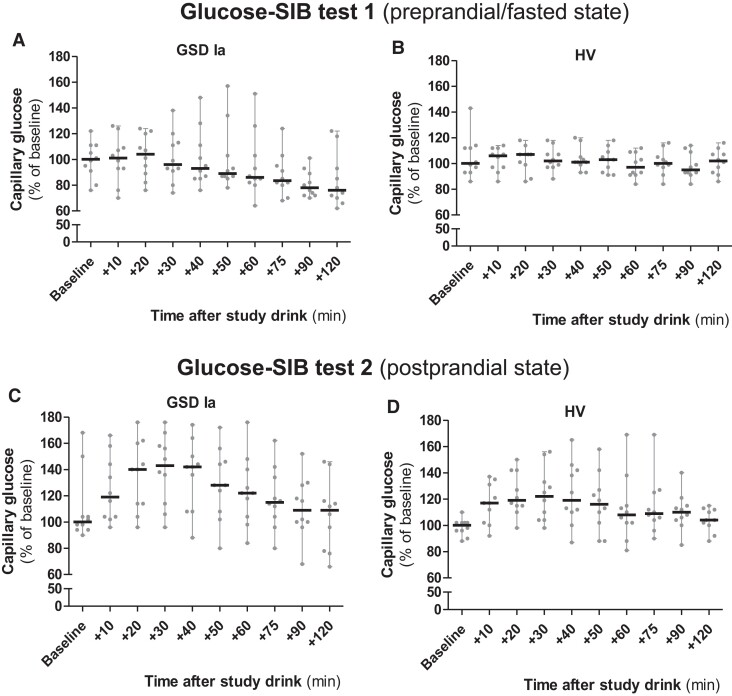
Figure 3.
Capillary and CGM glucose concentrations during glucose-SIB test 1 and glucose-SIB test 2. Capillary glucose concentrations (CBG) during glucose-SIB test 1 and 2 in patients with GSDIa (n = 100 [ie, 10 time points × 10 participants] per each glucose-SIB test) and HVs (HVs, n = 100 [ie, 10 time points × 10 participants] per each glucose-SIB test). Results are calculated compared with median baseline values calculated in each subgroup (ie, GSDIa and HVs, respectively) for each glucose-SIB test (100% = median of baseline values in each subgroup) and presented as median with range (grey circles show single participants’ values). 20% = 1 mmol/L glucose.

