
FIG. 5.
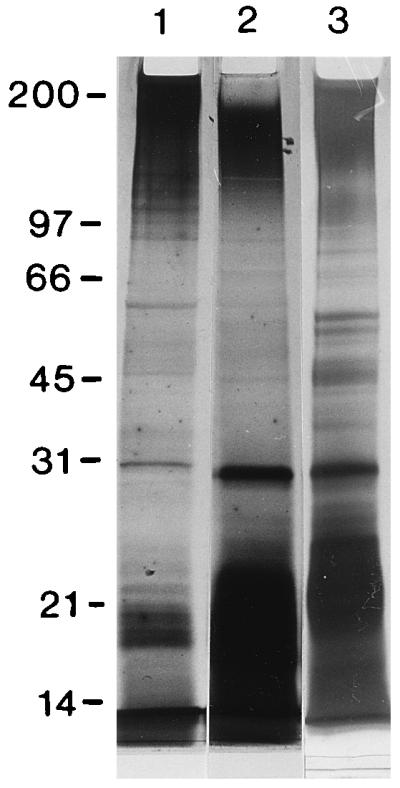
Qualitative comparison by SDS-PAGE of T. denticola ATCC 35405 whole cells (lane 1), OM extract run at the same time (lane 2), and repeat of the OM extract run in a different gel to resolve mid-range bands more clearly (lane 3). The positions of molecular size standards (broad-range SDS-PAGE standards; Bio-Rad) are shown in kilodaltons at the left. Conditions were as follows: Washed T. denticola suspensions (optical density of 1.2 at 550 nm) from 3-day cultures or undiluted OM extract were mixed 1:1 with sample buffer (0.25 M Tris-HCl [pH 6.8], 20% glycerol, 4.6% SDS, 0.02% bromophenol blue, 10% β-mercaptoethanol) and boiled for 10 min; 25 μl was added to each lane of a 1-mm-thick Ready Gel (Bio-Rad) with a 4% stacking gel and 12% resolving gel. Electrophoresis was run in a Mini-Protean II cell (Bio-Rad). Whole cells and OM extract had several bands in common.