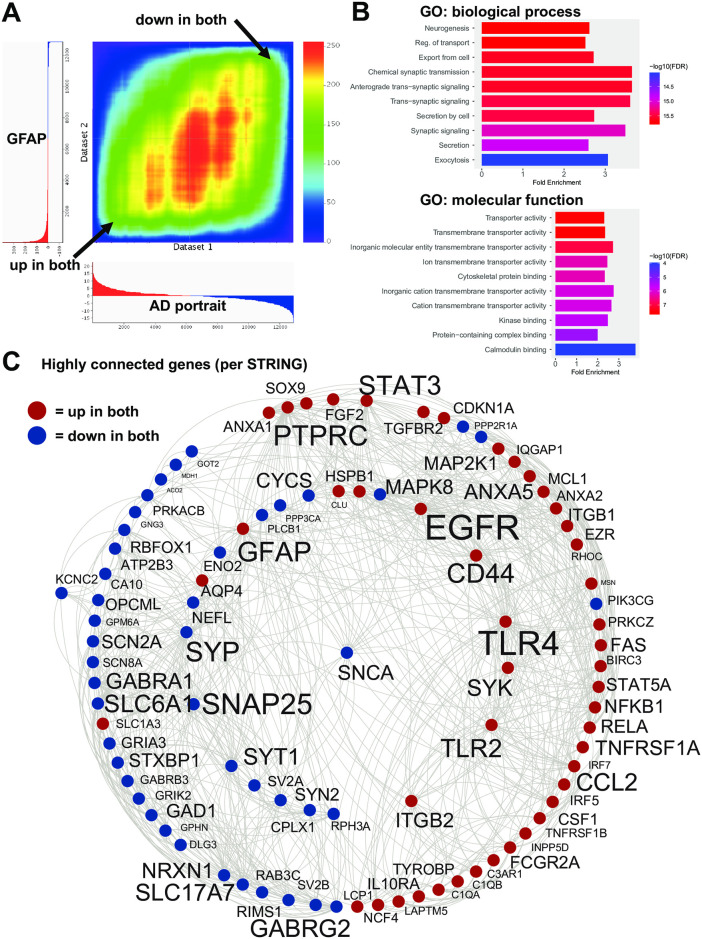
Fig 2. Congruent gene expression in GFAP mice and human AD.
A: An RRHO heatmap [26] of the AD portrait (X axis) with the GFAP mutation mice (hippocampus; second ranked model) (Y axis) indicates a high matching of up-up and down-down genes (arrows). B: Enrichment analysis of common up and down regulated genes is shown using ShinyGO [28]. C: Congruent genes with the highest levels of protein-protein interaction (determined via STRING [29]) are plotted in Cytoscape [30]. Interactions are highlighted by lines. AD and model upregulated genes are shown in red and AD and model downregulated genes are shown in blue. Increased size of font for gene symbol reflects higher number of connections between genes. Common genes of interest include: GFAP, EGFR, TLR4, SNAP25, PTPRC, and SNCA.

