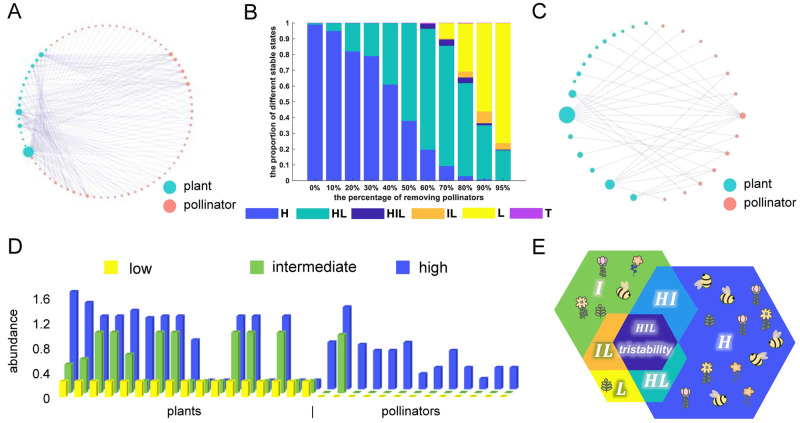
Fig 1. Multistability in the plant-pollinator network.
(A) Raw network structure of an empirical mutualistic network from actual observation data [40]. (B) The proportion of different stable states (y-axis) with random removal of a certain percentage of pollinators (x-axis). Total 1000 sub-networks are simulated in each column except for the first (0% represents the original network). (C) A typical plant-pollinator network after removing 80% of pollinators, in which tristability occurs. (D) The abundance of 17 plant species and 13 pollinator species (indicated by each column) in low, intermediate and high stable states using default parameters. The default values are set as follows: , , , κ = 1.07, γ0 = 1, δ = 0.5, h = 0.2, μ(P) = μ(A) = 0.001. (E) Illustration of seven possible stable states, including monostable state, bistability and tristability. H: high state, HI: high-intermediate bistability, HL: high-low bistability, HIL: high-intermediate-low tristability, IL: intermediate-low bistability, L: low state, T: tetrastability.

