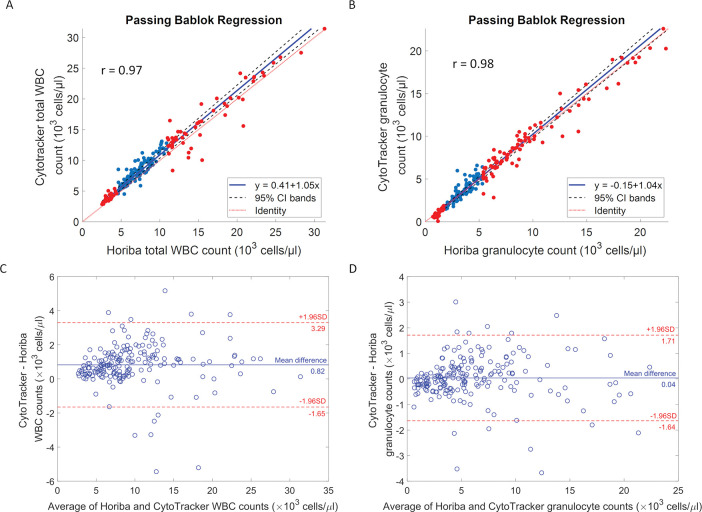
Fig 2. Passing-Bablok regression analyses and Bland-Altman plots.
Passing-Bablok regression analyses between Horiba results and CytoTracker results. (A) Total WBC count: slope: 1.05 (95% CI 1.02 to 1.08) intercept: 0.41 (95% CI 0.15 to 0.65) (B) granulocyte count: slope: 1.04 (95% CI 1.01 to 1.07) intercept: -0.15 (95% CI -0.30 to -0.04). The x-axis is the measured cell counts obtained using the Horiba hematology analyzer, while the y-axis is the measured cell counts obtained using the CytoTracker. The red dots represent samples flagged for abnormal counts outside of the normal range for WBC (4.5 k/μl—11 k/μl) and granulocytes (1.2 k/μl—6.8 k/μl). The solid blue line represents the regression line, the dashed red line represents the line of identity, and 95% confidence intervals are represented by the black dashed lines. Bland-Altman plots present level of agreement between CytoTracker and Horiba on WBC count (C) and granulocyte count (D), with the mean of the differences (blue solid line) and ± 1.96 SD limits (red dashed lines).

