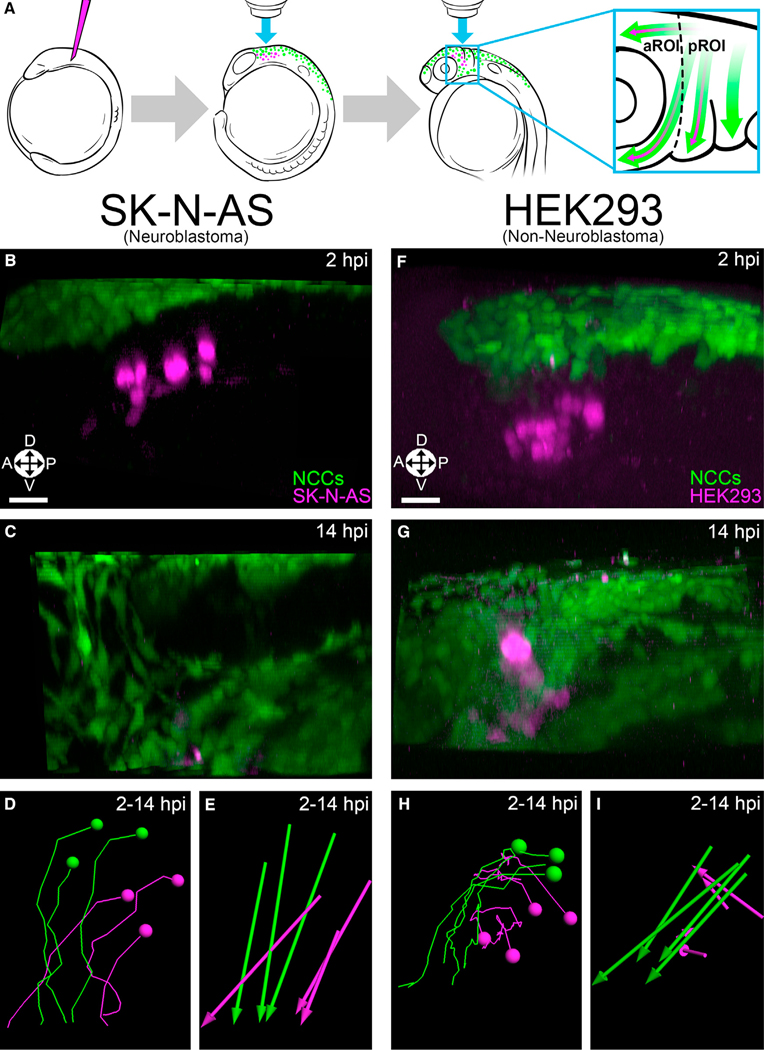
Figure 1. NB cells, but not control cells, comigrate with cranial NCCs.
(A) Schematic representation of the procedure used to study NB in live zebrafish embryos. Dotted line divides the aROI and pROI, and arrows indicate NC (green) and NB (purple) migration.
(B and C) 3D projections of Hoechst 34580-labeled (nuclear) injected SK-N-AS NB cells (purple; n = 8 embryos) alongside NCCs (green) at 2 hpi (premigratory) (B) and 14 hpi (C) in zebrafish embryos.
(D and E) SK-N-AS cell tracks (D) and displacements (E) at 2–14 hpi.
(F and G) 3D projections of Hoechst 34580-labeled HEK293 cells (n = 5 embryos) alongside NCCs at 2 hpi (F) and 14 hpi (G). HEK293 cell tracks (H) and dis- placements (I) at 2–14 hpi. Orientation: A: anterior; P, posterior; L, lateral; D, dorsal; V, ventral. Scale bar (B–I), 30 μm.

