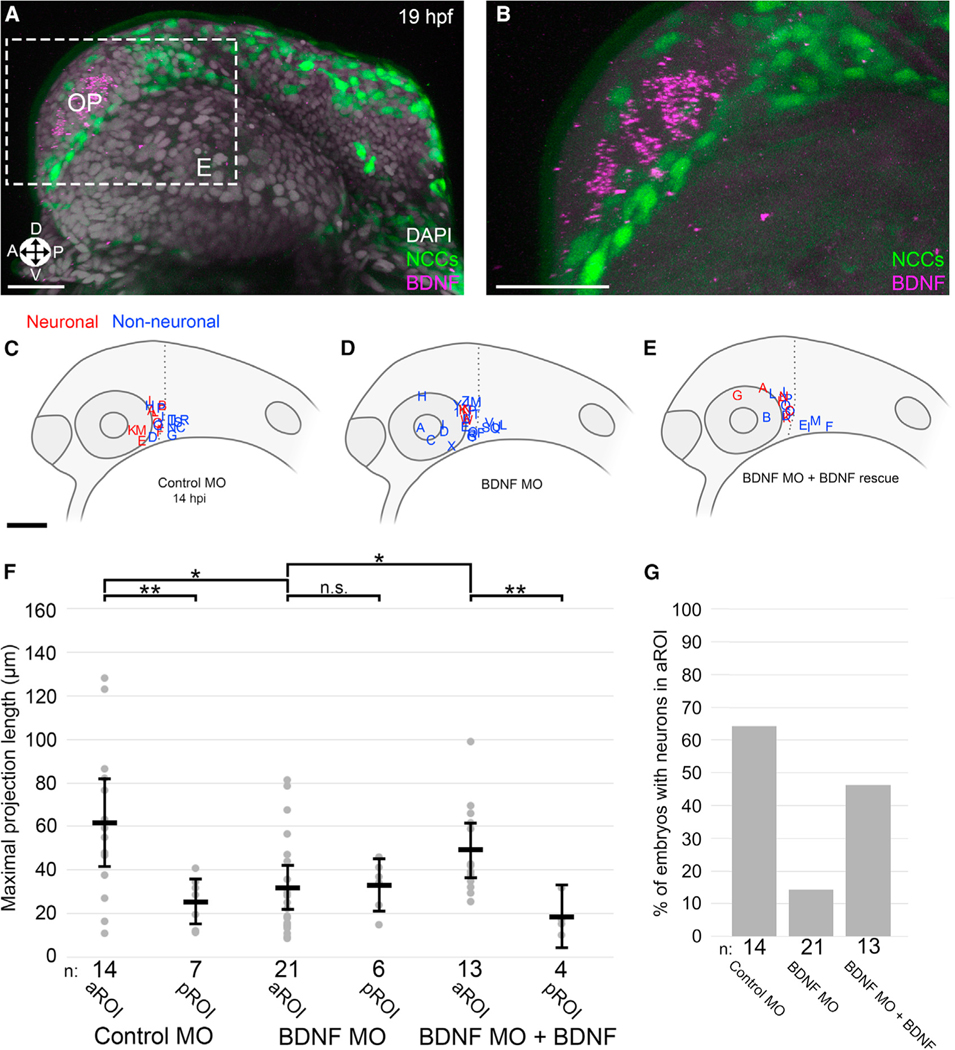
Figure 5. Microenvironmental BDNF signaling is required for NB differentiation.
(A and B) Representative 3D projection of BDNF HCR (purple), NCCs (green), and DAPI nuclear labeling (gray) (A) with inset (B) (gray) in 19 hpf zebrafish embryos, corresponding developmentally to 5 hpi. E, eye; OP, olfactory placode; Orientation: A, anterior; P, posterior; D, dorsal; V, ventral.
(C–E) Lateral view schematics of zebrafish embryos at 14 hpi that were injected with membrane-localized mCherry-expressing SK-N-AS NB cells after injection at the 1-cell stage with (C) 5 ng control morpholino (MO), (D) 2 ng BDNF translation-blocking MO, or (E) 2 ng BDNF translation-blocking MO + 200 ng/mL human BDNF starting at 4 hpf. Red and blue labels indicate final locations of neuronal and non-neuronal cells, respectively.
(F) Scatter plot of maximal projection lengths segregated into aROI and pROI. Horizontal bars denote mean values, with 95% confidence intervals indicated. n.s. p > 0.05, *p < 0.05, **p < 0.01.
(G) Percentage of embryos in which SK-N-AS cells differentiated into neurons in the aROI. Scale bar (A and B), 20 μm. Scale bar (C–E), 100 μm.

