Figure 1.
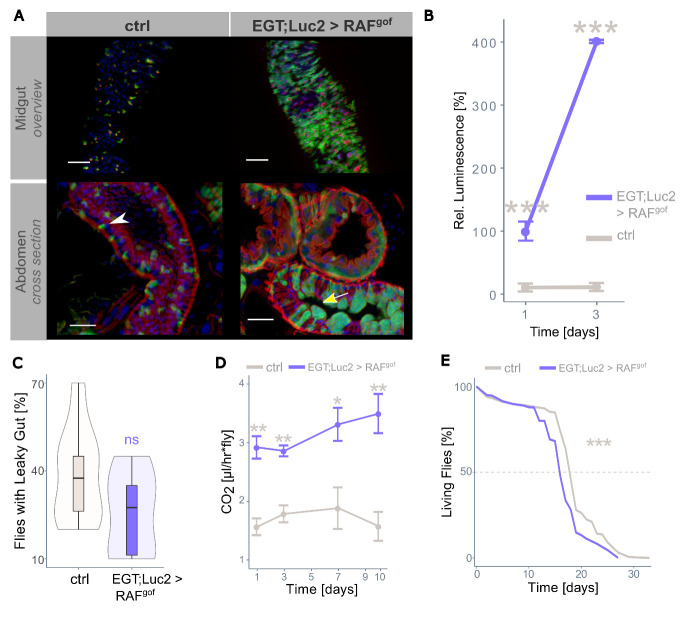
RAFgof expression in intestinal stem cells and progenitor cells leads to tumor formation. (A) Overview of the posterior midgut (top panels) and cross-section of the abdomen (lower panels) of control (ctrl, EGT;Luc2 > w1118) and tumor-bearing flies (EGT;Luc2 > RAFgof) after 3 days of oncogene induction (29°C). The white arrowhead indicates normal-sized progenitor cells in controls and the yellow arrow indicates progenitor cell accumulations in RAFgof expressing flies. Note the cell clusters protruding into the lumen. Actin was stained with phalloidin (red) with additional staining of nuclei with DAPI (blue). Scale bar: 50 µm. (B) RAFgof co-expressed luciferase signal in control flies and tumor-bearing flies (mean ± SEM, n=5-6). The level of luminescence measured after 24h of oncogene induction in the tumor-bearing flies is taken as 100%. (C) The gut integrity of healthy controls and tumor-bearing flies was not significantly affected after 3 days of oncogene induction (n=100). (D) Resting metabolic rate of control and tumor-bearing flies over time (mean ± SEM, n=5-10). (E) Lifespan of control and tumor-bearing flies at 29°C (n=450 flies per treatment). In all experiments, flies were fed a normal control diet. Here and in all figures, significance is indicated as * p < 0.05; ** p < 0.01; *** p < 0.001; ns: not significant, with colors representing the partner for comparison.

