
Figure 5.
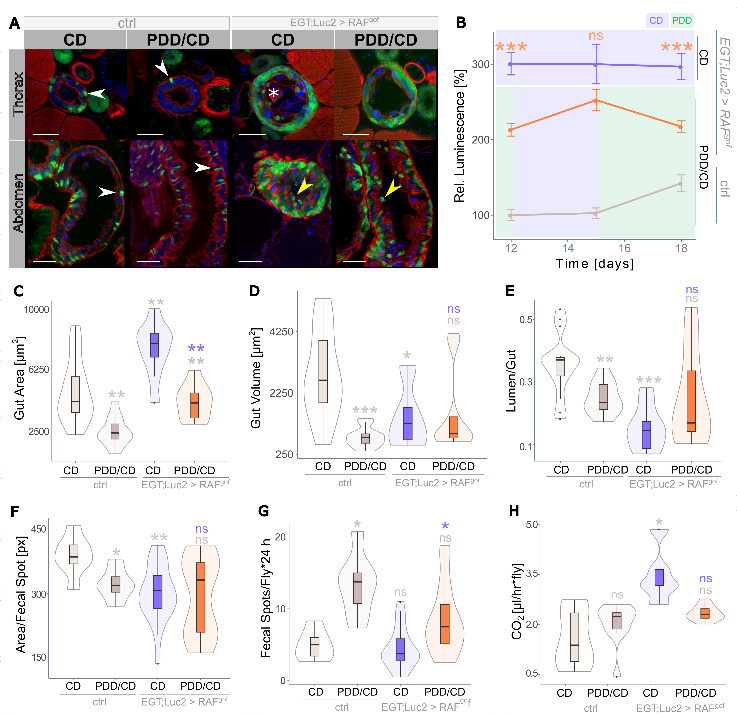
Recurrent protein depletion rescues tumor phenotype. (A) Sections through thorax (upper panel) or abdomen (lower panel) of control and RAFgof expressing flies fed on CD and on Regime 2. The GFP+ esg+ cells attached to the basal membrane (arrowheads) and protruding mass (asterisk) visible in RAFgof expressing flies subjected to CD are mostly absent following Regime 2 feeding. That feeding also resulted in detached esg+ cells (yellow arrowhead, scale bar: 50 µm). Images were taken after 10 days of treatment. (B) Co-expressed luciferase in progenitor cells in control flies on CD and RAFgof expressing flies on Regime 1 feeding for 12 to 18 days (n=5-10). (C) Total gut area per cross section, (D) lumen volume per cross section and (E) lumen-to-gut ratio of control and RAFgof expressing flies subjected to CD or Regime 2 feeding for 10 days (n=9-11). (F) Fecal spot size and (G) fecal spot numbers at day 10 (n=7-21). (H) Basic metabolic rate at day 10 (n=5-10).