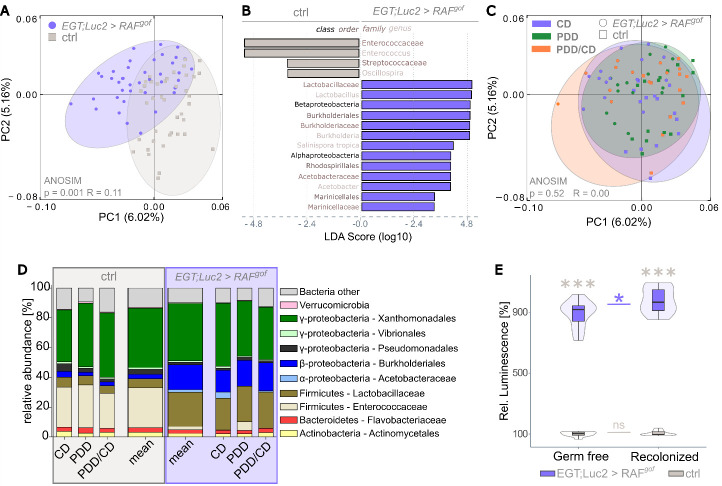
Figure 6.
Tumor induction leads to a shift in microbiome composition that is independent of nutritional input. The intestinal microbiome was assessed by 16S rRNA analysis after 3, 6, and 10 days of tumor induction on the respective feeding regime (n=5 per each), and these time points were pooled prior to analysis. (A) Principal Coordinates Analysis (PCoA) segregates the sequence data from control and tumor-bearing flies. Ellipses were added manually. (B) Linear discriminant analysis (LDA) on the relative abundance of taxonomic groups in the control and tumor-bearing flies. Bars represent taxa specifically associated with either genotype. (C) PCoA as in panel A is now colored for the feeding regime. (D) Bar plots showing the relative abundance of bacterial taxa obtained with the indicated diets and the mean of all data combined. (E) Luciferase activity in progenitor cells in control and oncogene-expressing flies raised germ-free and following recolonization, after 3 days of oncogene induction on CD (n=10).

