Figure 7.

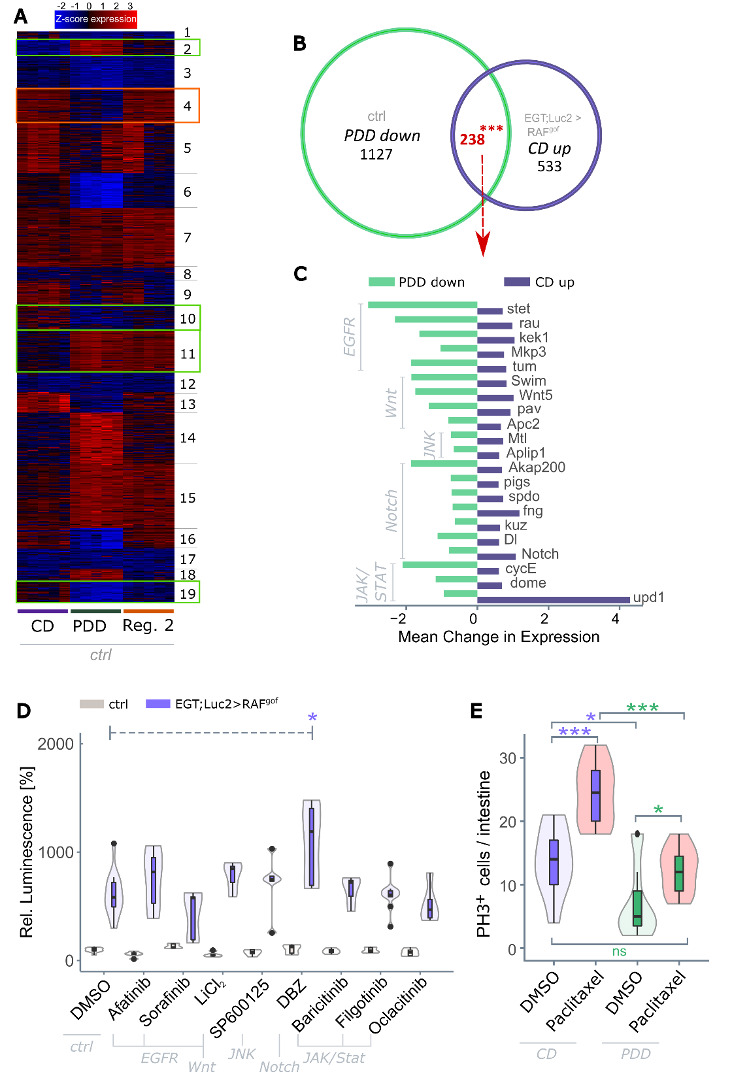
PDD has a distinct transcriptomic signature that can not be mimicked through drug exposure. (A) K-means clustering of differentially expressed genes (degs) of control flies feeding on control diet (CD), protein-depleted diet (PDD), or the Regime 2 diet (cf. Fig. 4) for 13 days with p < 0.001 and fold change > 4 (n = 5). Clusters were identified that exhibited either a memory effect (green boxes, cluster 2, 10, 11, 19), or showed resilience (red box, cluster 4). (B) Venn diagram of degs that were downregulated in healthy flies on PDD and upregulated in tumor-bearing flies on CD (both compared to control flies on CD) after 13 days of oncogene induction (n=5). (C) Fold expression changes of a subset of the 238 degs identified in panel B that were involved in five major signaling pathways. (D) RAFgof co-expressed luciferase signal in control flies and in flies expressing RAFgof after 3 days of tumor induction and simultaneous subjection to pathway-specific inhibitors. Luminescence in healthy flies after 3 days at 29°C on DMSO is taken as 100% (n=4-19). (E) Number of actively proliferating cells as measured by quantifying phospho-histone H3+ (PH3+) cells in healthy w1118 flies after 3 days of subjection to Paclitaxel or DMSO (n=9-15). DBZ = Dibenzazepine, DMSO = dimethyl sulfoxide.
