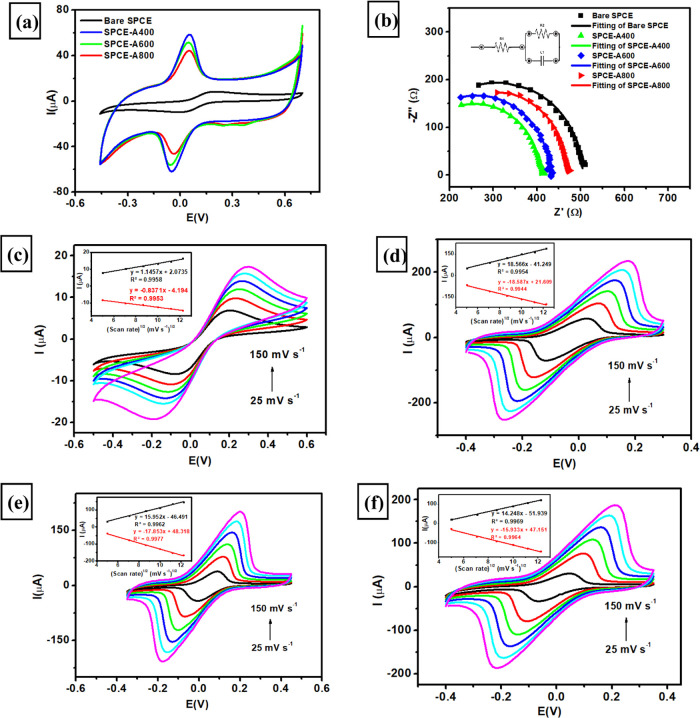
Figure 4.
(a) Cyclic voltammograms obtained at a scan rate 50 mV s–1, (b) Nyquist plot for the measurements of 1 mM K3[Fe(CN)6] in 0.1 M KCl using four different electrodes at a frequency range from 106 to 102 Hz, Edc = 0 V, and Eac = 10 mV, cyclic voltammogram obtained at various scan rates (25–150 mV s–1) for the measurements of 1 mM K3[Fe(CN)6] in 0.1 M KCl using (c) bare SPCE, (d) SPCE-A400, (e) SPCE-A600, and (f) SPCE-A800.

