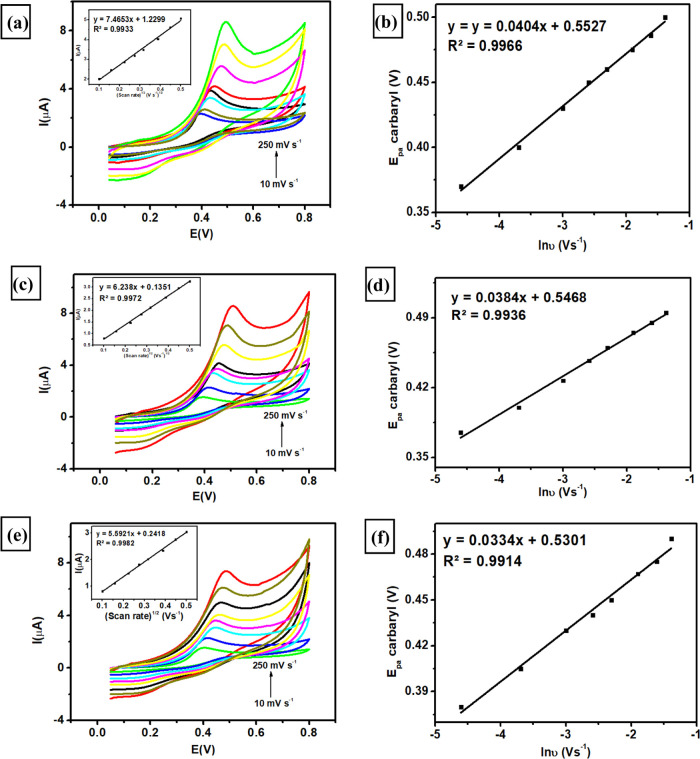
Figure 6.
(a, c, e) Voltammograms at various scan rates (10–250 mV s–1) were obtained from the measurement of 100 μM carbaryl in 0.1 M phosphate buffer of pH 4 using three modified electrodes (SPCE-A400, SPCE-A600, and SPCE-A800) and (b, d, f) corresponding linear plot between the natural logarithm of the scan rates (ln v) versus the anodic peak potential (Epa) of carbaryl oxidation.

