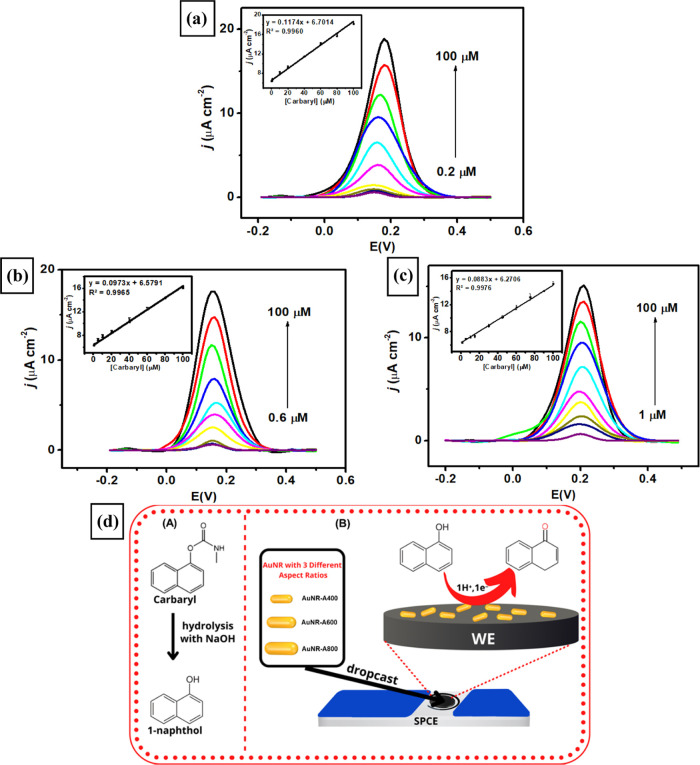
Figure 8.
Voltammograms at a scan rate of 50 mV s–1 obtained from the measurements of 0.1 M pH 4 phosphate buffer containing different concentrations of carbaryl employing (a) SPCE-A400, (b) SPCE-A600, and (c) SPCE-A800. Inset image: the corresponding calibration plot between the peak current intensity versus different concentrations of carbaryl, (d) schematic illustration of panel (A) hydrolysis reaction from carbaryl into 1-naphthol and (B) mechanism of electrochemical sensing performance based on SPCE-modified AuNR with three different aspect ratios by 1-naphthol oxidation.

