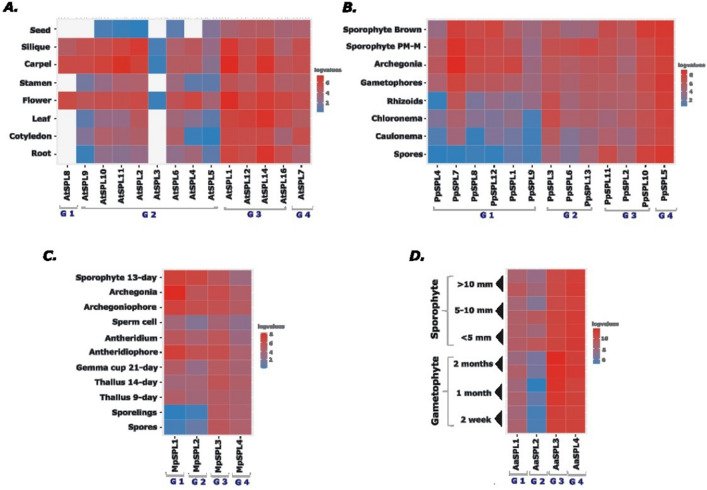
Figure 6.
The expression profiles of SPL genes from different developmental stages and organs of A. agrestis, M. polymorpha, P. patens, and A. thaliana. TPM and FPKM values were identified from RNA-seq data and normalized by log2 transformation for: (A) A. thaliana77, (B) P. patens58, (C) M. polymorpha59 and (D) A. agrestis 60. The heatmap was generated in RStudio61. G1-G4 denotes the names of SPL phylogenetic groups, Group 1–4. The red, blue and white colours denote high, low and no expression values.

