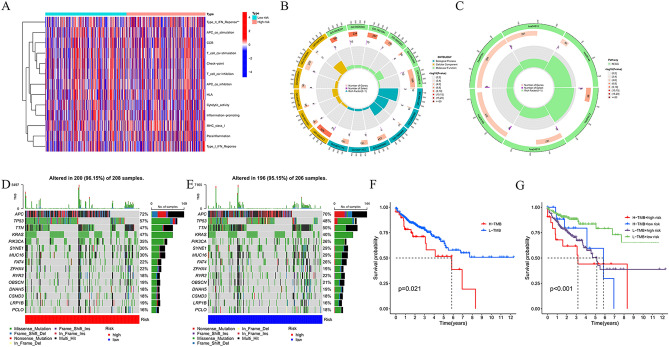
Figure 6.
Mechanisms related to MCRG risk signature in COAD. (A) Heat map of immune cell inflammation in high- and low-risk populations. (B) Gene Ontology (GO). (C) KEGG analysis. (D) Frequency and type of gene mutations in high-risk group. € Frequency and type of gene mutations in the low-risk group. (F) OS survival curve analysis in low TMB group and high TMB group. (G) OS survival curve analysis between different TMB subgroups in high and low risk groups.

