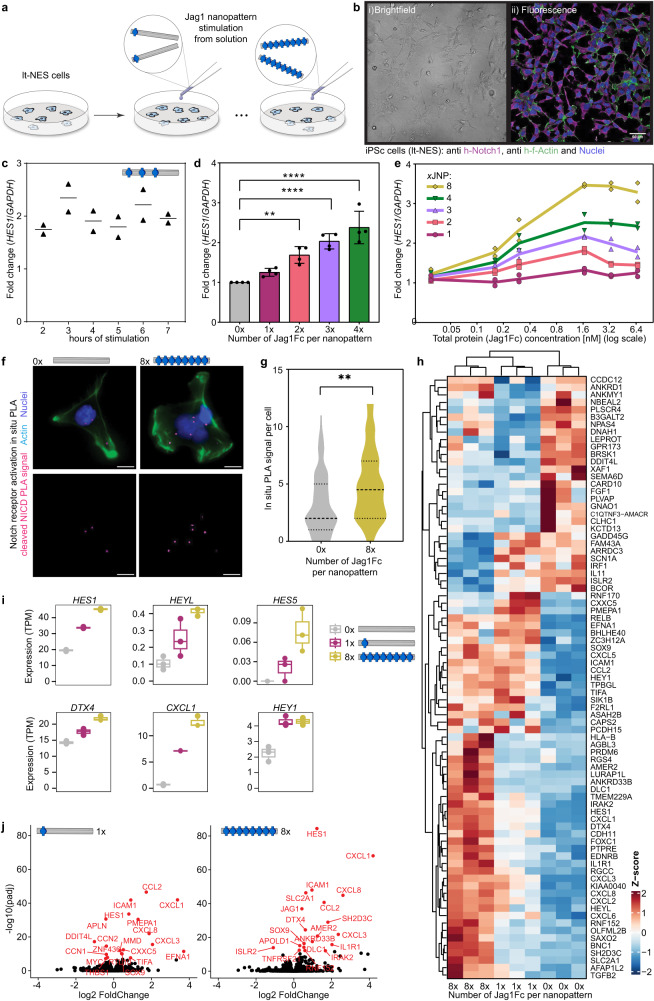
Fig. 3. Activation of the Notch pathway by Jag1Fc-nanopatterns.
a Origami decorated with 1-4 (28 nm separations) or 8 (14 nm separations) Jag1Fc are used to stimulate iPSc-derived neuroepithelial stem-like (lt-NES) cells. b Microscopy of lt-NES cells shown in i) brightfield and ii) fluorescence channel immunostained for Notch1 (magenta), F-actin (green), and nucleus (blue). Scale bar, 50 μm. c Time course of lt-NES cells stimulated with 3x JNP. Relative expression of HES1 from qPCR normalized to parallel samples stimulated with empty(0x) structures. Points represent individual data for n = 2 biological repeats d Effect of different number of Jag1Fcs. Relative expression of HES1 from qPCR normalized to sample with empty structures for 1-4x JNPs. Bar graphs represent mean expression levels ± SD and black dots indicate individual data points for n = 4 biological replicates. Statistical analysis of the data was performed using one-way analysis of variance (ANOVA) followed by Dunnett multiple-comparison test (**P = 0.0026, ****P < 0.0001). e Dosage effect. lt-NES cells stimulated with 1-8x JNP at increasing concentrations. Relative expression of HES1 from qPCR normalized as in (c). Points represent individual data for n = 2 biological repeats f Proximity Ligation Assay (PLA) performed using antibodies against cleaved NICD on stimulated lt-NES cells. Representative images of cells for each condition: PLA dots (magenta), F-actin (green) and nucleus (blue). Scale bars, 10 μm. g Violin plot of the PLA experiment from image analysis of 50 cells for each condition. Statistical analysis of the data was performed using ANOVA followed by Tukey multiple-comparison test (**P = 0.0011). h Heat map diagram of mRNA sequencing experiment performed on lt-NES cells after stimulation with JNPs. Three biological repeats for each condition were shown for genes with FDR < 0.05 and absolute log2FC > 0.5. Data is shown automatically clustered using hierarchical complete-linkage clustering of Euclidean distances. i Selection of Notch pathway-related genes from RNA seq, transcripts per million (TPM) plotted for each condition. Box plots shown as median, first and third quartiles with whiskers extending up to 1.5 x inter-quartile range (IQR) and individual data points represent data for n = 3 biological repeats j Volcano plots of genes upregulated by 1x JNP and 8x JNP relative to 0x JNP. Source data are provided as a Source Data file.

