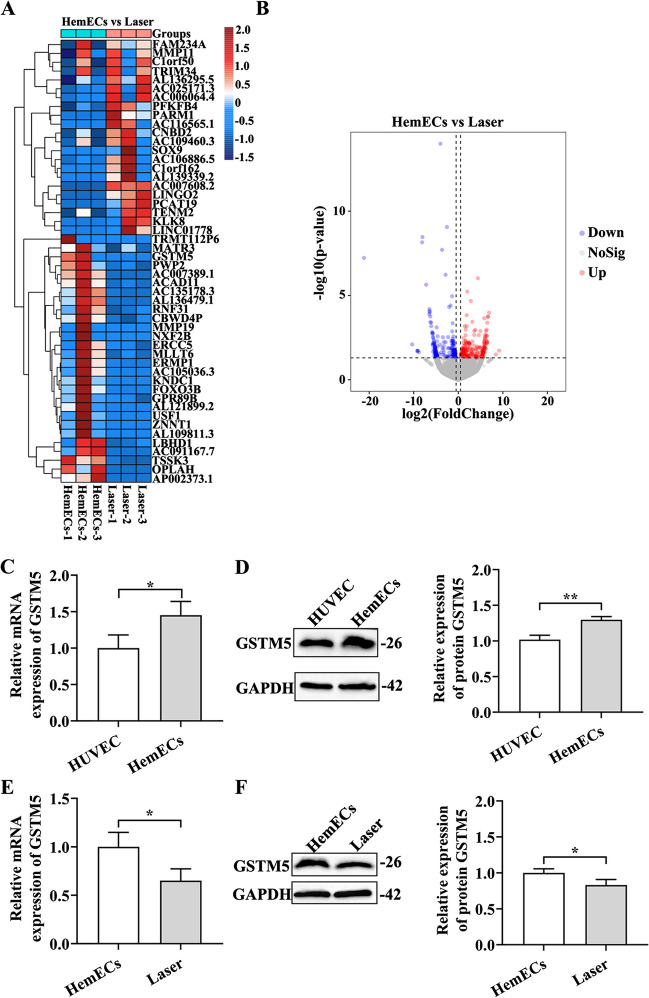
Fig. 3.
Laser-mediated controlled over GSTM5 and the regulation of other gene expressions in HemECs. A Hierarchical heatmap of differentially expressed genes. The heatmap was generated using log2(TPM + 1) values of the differentially expressed genes, with red and blue indicating high and low expression levels of the gene TPM, respectively. B Volcano plot of differentially expressed genes, where red represents upregulated genes and blue represents downregulated genes. C Quantitative analysis of GSTM5 mRNA expression in HemECs. D Western blot images and quantitative analysis of GSTM5 protein expression levels in HemECs. E Quantitative analysis of GSTM5 mRNA expression in HemECs following laser treatment. F Western blot images and quantitative analysis of GSTM5 protein expression levels in HemECs following laser treatment. *P < 0.05, **P < 0.01

