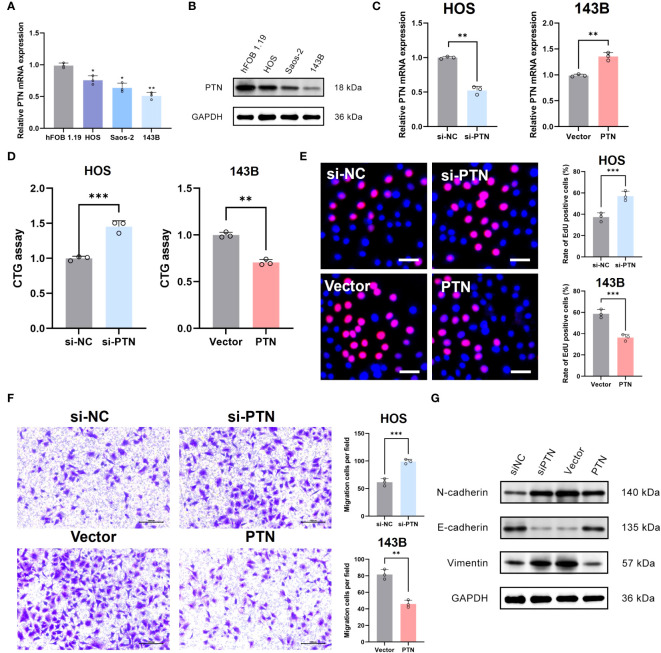
Figure 8.
Determination of PTN as a novel suppressor in OSA. (A, B) The expression pattern of PTN at mRNA and protein levels in hFOB 1.19 and three OSA cell lines. (C) Transfection efficiency was tested by qRT-PCR. (D, E) The effect of PTN on cell viability was detected by CTG assay and EdU assay. Scale bar, 200 μm. (F) The effect of LCP1 on cell migration was detected using Transwell. Scale bar, 100 μm. (G) WB analysis investigate the relationship between PTN and EMT biomarker (N-cadherin, E-cadherin and Vimentin). *p< 0.05, **p< 0.01, ***p< 0.001.

