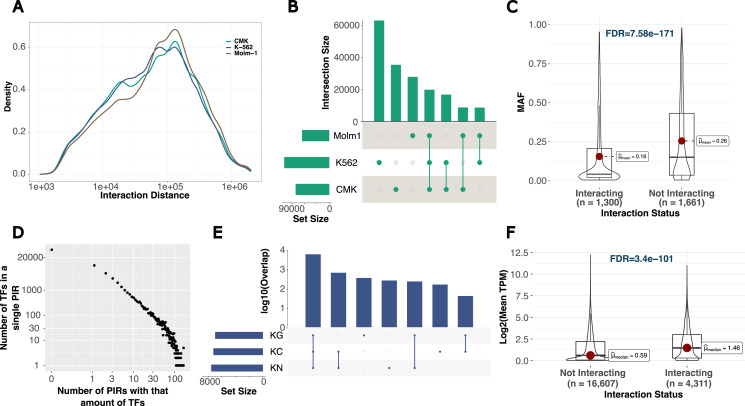
Figure 2. Interactome organization across different cell lines and treatments.
(A) Absolute interaction distance distribution of all interactions. (B) The overlap of interactions across cell types. (C) Dependence of targeted SNVs with different MAFs on their interaction status. (D) The distribution of the number of TFs found in each PIR. (E) The overlap statistics of interacting genes in K-562 cells (K) between treatments: carboplatin (C), gemcitabine (G), or no drug (N). (F) Dependence of gene expression on the interaction status of genes.

