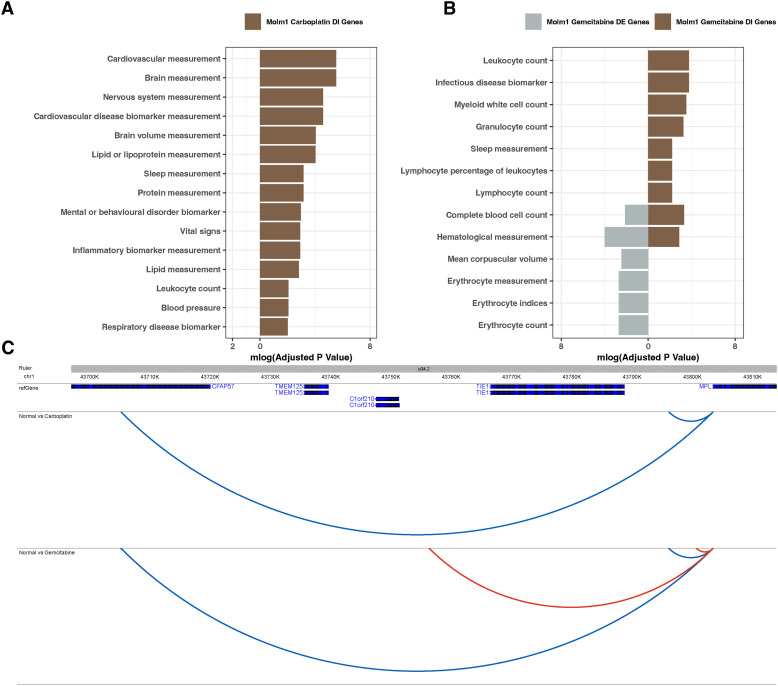
Figure S8. Comparison of DE and DI genes in MOLM-1 cells.
(A, B) Gene enrichments of DE (grey) and DI (brown) genes of MOLM-1 cells upon (A) carboplatin and (B) gemcitabine treatment. (C) The interaction profile of MPL upon carboplatin and gemcitabine treatment; static interactions are shown in blue, whereas gained interactions upon treatment are shown in red.

