Fig. 1.
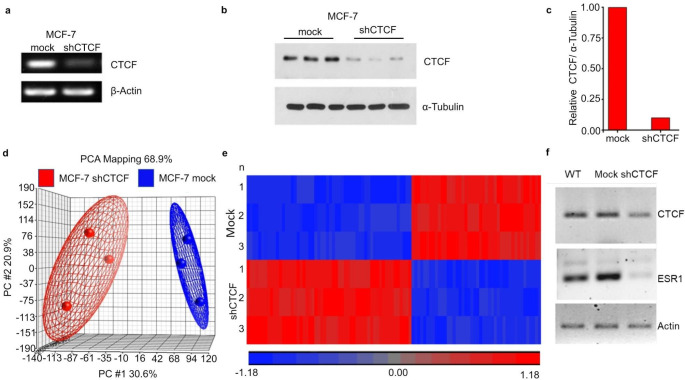
Expression profile of shCTCF MCF7 cells and mock transduced cells. a RT-PCR of CTCF in MCF-7 cells transduced with shCTCF or not (mock). Β-actin was used as a loading control. b Western blot of CTCF in MCF-7 cells transduced with shCTCF or not (mock). α-Tubulin was used as a loading control. c Densitometry analysis of the western blot in b. d PCA analysis to compare the intragroup and intergroup variations in the general gene expression profiles of MCF-7 cells transduced with shCTCF or not (mock). Each circle represents a biological replica. e Heat map representation of the hierarchical clustering analysis of the 78 differentially expressed genes (columns) between MCF-7 cells transduced without (mock) or with shCTCF. Each row represents an independent experiment. The 36 downregulated genes and the 42 upregulated genes between the experimental conditions are depicted in hues of blue and red, respectively. f RT-PCR of CTCF and ESR1 in wild type (WT), mock transduced or shCTCF transduced MCF7 cells. Actin was used as a loading control

