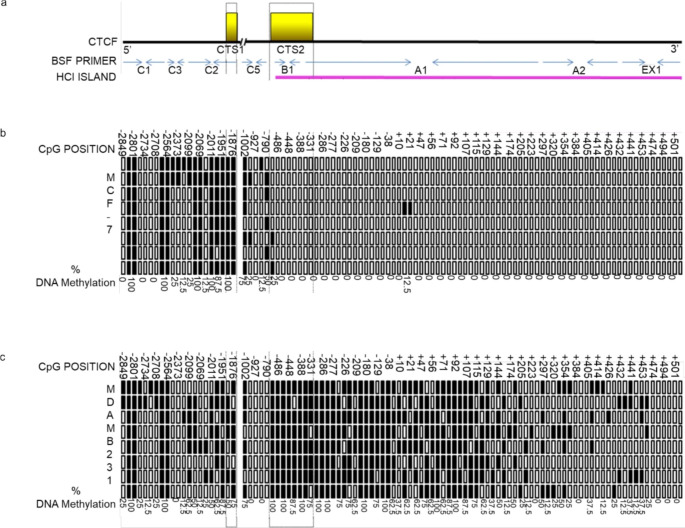
Fig. 3.
DNA methylation status of the ESR1 gene promoter in MCF-7 and MDA-MB-231 cells. a Schematic diagram showing as yellow rectangles, CTCF’s binding sites (CTS1 & 2); as blue arrows, the binding sites of the primers that were used to amplify these loci and as a pink rectangle, the location of the HCI. b MCF-7’s DNA methylation status, in the section of the ESR1 gene promoter where CTS1 & 2 are located. Each row represents a technical replica, and each column is a specific CpG. Methylated CpGs are filled in black and unmethylated ones are not. The % of methylation in each CpG is indicated at the bottom of each column. c Same as b but for MDA-MB-231 cells

