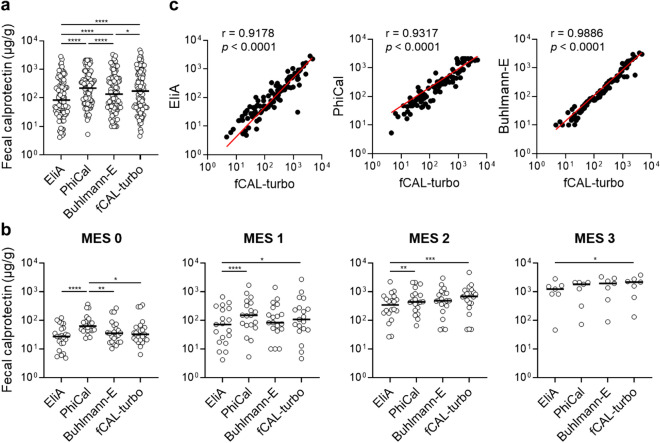
Figure 2.
Fecal calprotectin values obtained with examined kits. (a, b) Fecal calprotectin concentrations determined by use of the EliA, PhiCal, Buhlmann-E, and fCAL-turbo kits are shown for all of the samples (a. n = 94) and several disease conditions (b. n = 69; MES 0/1/2/3 = 23/19/20/7). Dunn’s multiple comparison test with Friedman’s test was used for the analyses. *p < 0.05, **p < 0.01, ***p < 0.001, ****p < 0.0001. (c) Spearman’s rank correlation analysis. Spearman’s correlation coefficient (r) values are shown. MES: Mayo endoscopic subscore.

