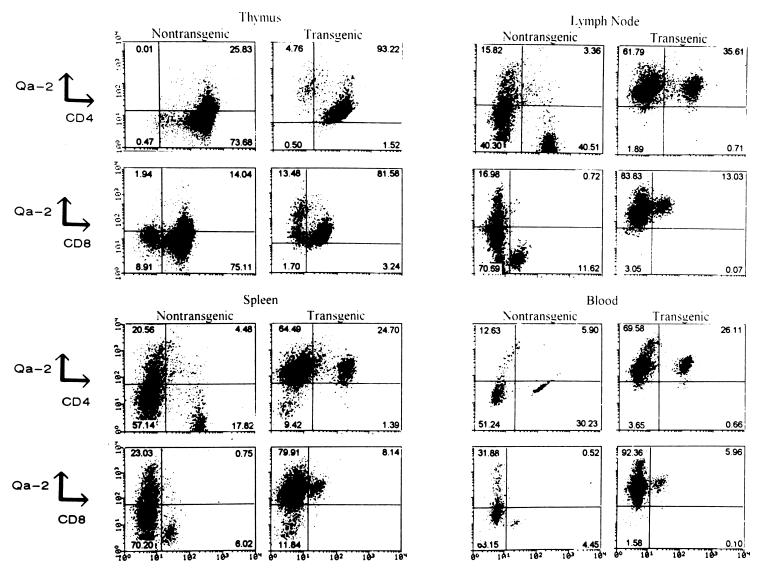
FIG. 3.
Two-color FACS analysis of thymus, spleen, lymph nodes, and blood cells from transgenic and nontransgenic mice. Cells were stained with monoclonal antibodies for Qa-2, CD4, and CD8 to identify the expression of Qa-2 protein in both T-cell types. The percentage of cells in each quadrant is indicated. Equal numbers of events are plotted for each staining.

