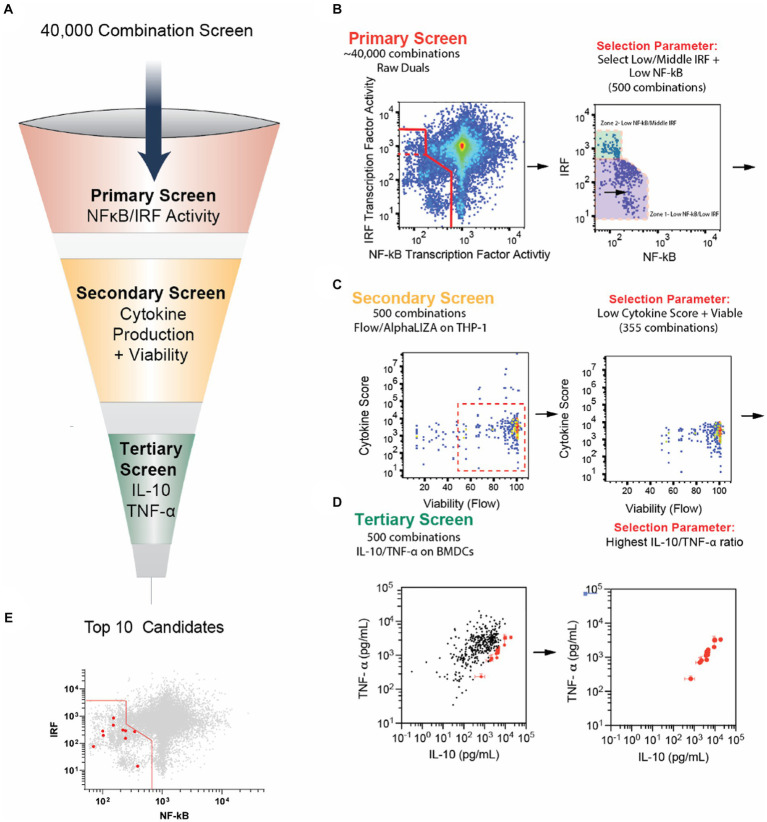
Figure 1.
Selection of new PPI candidates using high-throughput screening. (A) Schematic of screening process to evaluate PPI candidate combinations. (B) Primary screening results. Forty thousand combinations of small molecule modulators and agonists were tested on RAW-Dual cells to observe the effects on IRF and NF-κB activity. Combinations with low NF-κB activity and mid- to low IRF activity were chosen for a total of 500 combinations. (C) Secondary screening results. The 500 combinations from the primary screen were tested on THP-1 human monocytes overnight. Cell viability was monitored via microscopy, and the secretion of cytokines and chemokines, TNF-α, IL-6, IL-1β, IL-12, IP-10, CCL-4, and IFN-β, was monitored with AlphaLISA. Combinations with <50% viability were removed. Cytokine secretion was normalized to agonist-only control, multiplied by 1,000, and all six normalized scores were summed to generate a “cytokine score.” Combinations with cytokine score >6,000 (indicating an increase in overall inflammatory cytokines) were removed. (D) The remaining 355 combinations were tested on BMDCs for 24 h, and the secretion of IL-10 and TNF-α was measured using standard ELISA. The top 10 combinations with the highest IL-10/TNF-α ratio are highlighted in red. (E) Top 10 combinations are highlighted in red from the graph in part B. Note that the data for parts (B–D) were a re-analysis of data originally obtained from a study by Kim et al. (14). Error bars in part E represent the ±SD of triplicate measurements. See the methods section for more information on the screening process.

