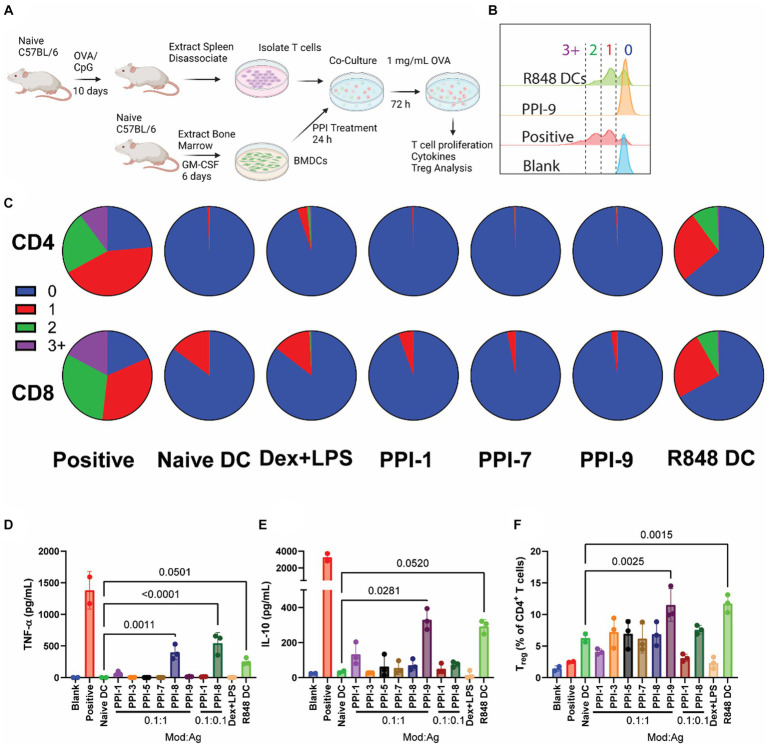
Figure 4.
OVA-specific PPI-tolDC-T-cell proliferation assay. (A) Schematic of OVA-specific ex vivo T-cell stimulation experiment used for data in parts (B–F). Here, 800K T cells from OVA-vaccinated mice were incubated with 200K DCs for each group in 2 mL of media. OVA stimulation was 1 mg/mL. T cells were analyzed after 72 h. Controls included T cells from OVA-vaccinated mice only (blank), T cells from OVA-vaccinated mice + naïve BMDCs +0.5 μL/mL T-cell stimulation cocktail with PMA/ionomycin (positive), and T cells from OVA-vaccinated mice + naïve BMDCs (naïve DC). All groups except Blank were treated with 10 μg/mL OVA. (B) Representative flow plot of OVA-specific T-cell proliferation for CD4+ T cells with gating for generation number. T-cell proliferation by generation number for each treatment was calculated for part C. (C) Representative pie charts showing the breakdown of average T-cell generation for selected treatment groups. Top: CD4+ T cells; bottom: CD8+ T cells. Complete dataset can be found in Supplementary Figure S5. (D) Supernatants were collected after 72 h and analyzed for IL-10 and (E) TNF-α secretion. (F) Cells were further analyzed for CD4+ CD25+ FoxP3+ T cells (Treg), and the percentage of Treg per CD4+ cells was calculated. Gating strategy is found in Supplementary Figure S7. Significance was determined by a two-tailed student’s t-test with p-values listed on graphs. All control samples were performed in duplicates, and experimental groups were performed in biological triplicates. Error bars are ±SD.

