Figure 6.
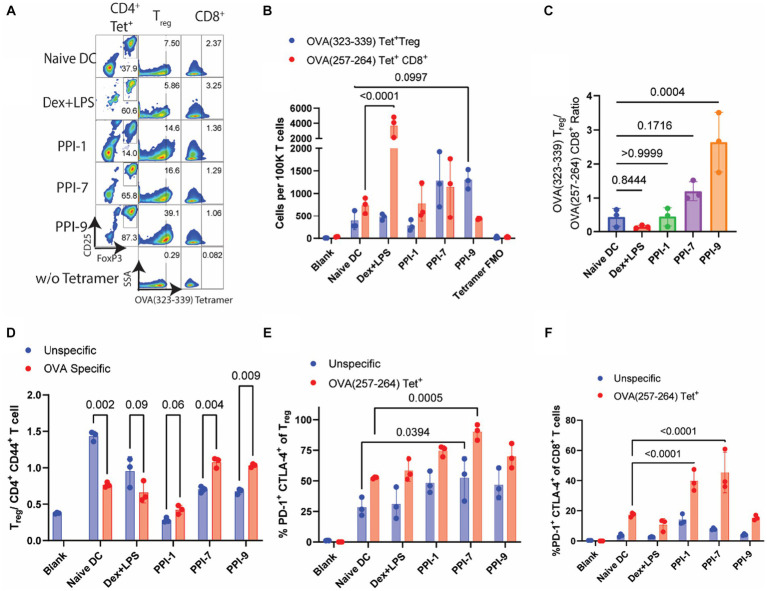
Analysis of OVA-specific T-cell responses from PPI-tolDC-treated T cells. The same groups for both unspecific (αCD3/CD28 simulated) and specific (OVA-stimulated) T cells from Figure 5 were further analyzed for OVA tetramer-positive populations. (A) Representative flow plots of OVA T-cell experiment. Left: OVA (323–339)-PE tetramer+ CD4+ T cells gated on CD25 and FoxP3 for Treg populations; Middle: Treg cell populations gated OVA (323–339)—PE tetramer+ populations; Right: CD8+ T-cell populations gated on OVA (257–264)—APC tetramer+. (B) Comparison of OVA (323–339)—PE tetramer+ Treg cells and OVA (257–264)—APC tetramer+ CD8+ T cells per 100K T cells for OVA-stimulated samples. (C) Ratios of OVA (323–339)—PE tetramer+ Treg cells by OVA (257–264)—APC tetramer+ CD8+ T cells per 100K T cells. (D) Comparison of OVA (323–339)—PE tetramer+ Treg cells and OVA (323–339)—PE tetramer+ CD4+ CD44+ T effector cells per 100K T cells. (E) Percentage of PD-1+ CTLA-4+ cells in either all Tregs (blue) or OVA (323–339)—PE tetramer+ Tregs (red). (F) Percentage of PD-1+ CTLA-4+ cells in either all CD8+ T cells (blue) or OVA (257–264)—APC tetramer+ CD8+ T cells (red). Gating strategies, including tetramers, are found in Supplementary Figure S8. All experiments in this figure were carried out in biological triplicate, and error bars in part E represent the ±SD of triplicate measurements. Significance was calculated using one-way ANOVA with Tukey post-hoc test for parts (A,B,F). All other significance was determined by two-tailed student’s t-test.

